How to make an SVG animation, from Illustrator to HTML

Last week, I discovered Rob Levin‘s podcast, “SVG Immersion: The Anything and Everything SVG Podcast.” On one of the episodes, Rob talked to front-end developer Petr Tichy about SVG animation, as Petr had created this really cool animated Christmas card using SVG. Just click on it and it watch it.

Cool, eh?

Inspired by Rob and Petr, I Googled how to create SVG animations myself. After looking at some examples and a few tutorials, I decided to attempt my own. This SVG animation was the result of my efforts. It was easier than I expected, and I think SVG animation is a tool my colleagues and I will be able to use for many interactive projects.

Below, I’ve written a tutorial of how I put the animation together. It’s a rather long explanation, but I wanted to document it in depth. I used the starter files from Mr. Map Generator to help build this animation and thus the tutorial will read similarly to the one I wrote for that.

To create this responsive SVG animation, I used Adobe Illustrator and a text editor. If you’re following along, I’m going to assume you are familiar with Illustrator and only a little familiarity with basic HTML. For the most part, this requires a lot of copying and pasting. You need not have any SVG experience, and I’ve written this as if the reader has never used SVG.

This was my first time using SVG animation, so I am not an expert by any means. Rather, I am writing this from a perspective to say, “Hey, look how easy this was for a newbie!”

Let’s get started. Here is a zip file of four files:

  • ocean.ai
  • starter.htm
  • svg.css
  • responsive.js

When you’ve downloaded the zip, open up the Illustrator file called ocean.ai.

You’ll see that there are elements hanging off the artboard. Our artboard is 600px wide and 400px tall. But when animating SVG, you can make your artboard whatever width or height you want.

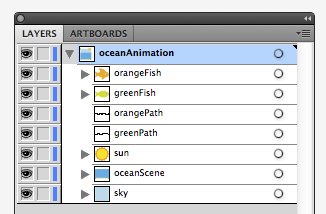
Each section of the ocean scene has its own layer in the Illustrator file. Furthermore, each layer has a name describing the content of said layer: greenFish, orangeFish, etc. These names are one word, with no spaces or breaks. This is important.

Our layers are:

  • orangeFish, the orange fish
  • greenFish, the green fish
  • orangePath, the path the orange path will swim along
  • greenPath, the path the green path will swim along
  • sun
  • oceanScene, which is the water and the sand
  • sky

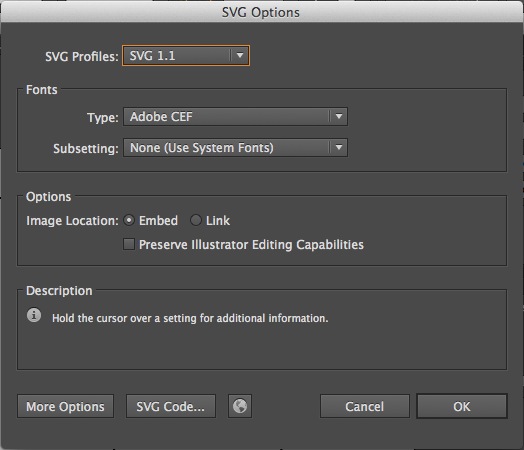
Save the Illustrator file as an SVG. It’s easy to do in the “Save As” settings.

Illustrator will give a pop-up and you can leave it be.
Once you’ve saved the file as an SVG in Illustrator, open the SVG in a text editor. Programs like Notepad or TextEdit are free with your computer. They are perfectly functional, but I use TextWrangler, which you can download for free. It color-codes tags in HTML and makes it easier to organize what you’re writing. Sublime and other editors are fine, too.

When you open the file in a text editor, it could look rather daunting if you’ve never looked at SVGs in text editors. Looks like a lot of gibberish, right?

And yet while it looks foreign at first, certain things will look familiar. Just as p tags and div tags need opening tags and closing tags, so do g tags. In SVGs, g tags are group tags. Another way to think of g tags is to think of them like div tags for SVGs. Like div tags, g tags can have classes and IDs.

Look at the line that says “viewbox.”

Look at the part that says viewbox=”0 0 600 400.” That 600 means the box for your SVG is 600 pixels wide and 400 means it is 400 pixels tall. We’re going to eventually delete that part, but before we do, write down those two numbers somewhere or copy them into another file.
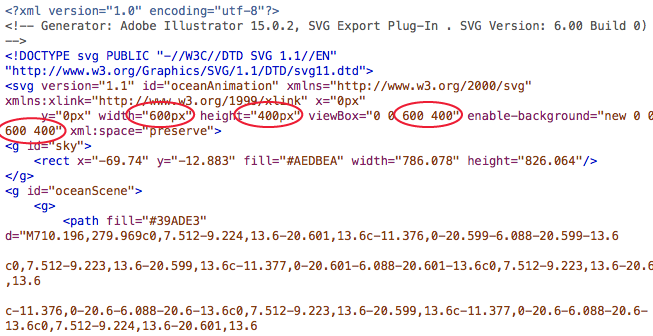
Write them down yet? Ya sure? OK, good.

In your text editor, highlight everything from the first line until the space just before the first g tag.

Got it highlighted? Good. Now delete that.

At the bottom of the document, highlight everything after the last closing g tag. And then hit delete.

Now select all that’s in the document and copy it. We’re ready to add it to our HTML file: starter.htm.

Look for the part that says, “HIGHLIGHT THIS AND PASTE YOUR SVG OVER IT!” Highlight that part, and well, do what it says: Delete it, and paste your SVG that you’ve cut and pasted.

In starter.htm, that is going to be on line 30.
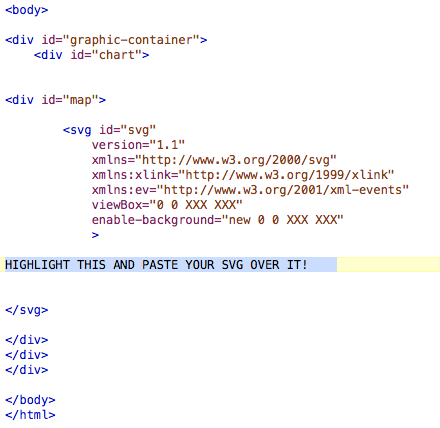
OK, now that you’ve pasted that, look for the areas that say “viewBox” and “enable-background.” Particularly, notice that they each include a line that says “0 0 XXX XXX.”

This is why I told you to write your width and height down. Or paste it somewhere. Because now you need it.

Paste over “XXX XXX” with your actual width and height. In our case with our file, we had a width of 600 and a height of 400, so we changed “0 0 XXX XXX” to “0 0 600 400″ in our file.

Open up responsive.js. The top three lines of the file will look like this:

Change the XX to reflect the appropriate value. Our exercise had a width of 600 and a height of 400.

Save the JS file and close it. You’re done with it.

At this point of the process, if you were to open up starter.htm in a browser, you’d get a static, non-moving image.

Now we are ready to start animating!

In your text editor, in starter.htm, find the g tag for sun.

Most of that code is for the orange part on the outside. The circle tag is for the middle circle of the sun.

The code that will do the animating will look like this:

<animateTransform attributeType=”xml”
attributeName=”transform”
type=”rotate”
from=”0″ to=”360″
begin=”0″ dur=”10s”
repeatCount=”indefinite” />

What that does is rotate the sun from 0 degrees to 360 degrees, beginning 0 seconds into the animation. The “dur” refers to the duration, which we have as 10 seconds. Where it says, “repeatCount,” we’ve left a value of “indefinite,” meaning we want it to repeat indefinitely. We will paste that just before the closing g tag. That will make our sun rotate.

Test it in the browser, and it should work!

Now we want to add code that will have the sun float up after 2 seconds. That could will look like this:

<animateTransform
attributeType=”XML”
attributeName=”transform”
type=”translate”
from=”0,0″ to=”0,-400″
begin=”2s” dur=”2″
fill=”freeze”/>

This will move the sun from an X,Y coordinate of 0,0 to 0,-400, 2 seconds in and over a period of 2 seconds. In other words, want it to move up 400 pixels over 2 seconds. We will paste that in the sun group, just after where we posted the rotating code: before the closing g tag.

Test it in the browser, and it should work. Except now we see that when the sun starts moving up, it has stopped rotating. We want it to keep rotating, though, as it moves up.

What we need to do is to add <g> tag between <g id=”sun”> and the first <path> tag. Then we add </g> tag before the second <animateTransform> tag.

That keeps the rotating animation going while moving the whole sun upward.

Now we want to add code that will have the water and sand float up after 2 seconds. That could will look exactly the same as the code we just added to the sun:

<animateTransform
attributeType=”XML”
attributeName=”transform”
type=”translate”
from=”0,0″ to=”0,-400″
begin=”2s” dur=”2″
fill=”freeze”/>

We add it to the code for “oceanScene,” which contains both the water and the sand. We add just before the final g tag:

This will move “oceanScene” from an X,Y coordinate of 0,0 to 0,-400, 2 seconds in and over a period of 2 seconds.

Test it in the browser, and it should work!

Now when we look at the page in the browser, we should see the sun rotate, and then after two seconds, the sun, water and sand move up. That gives the appearance that we’ve panned down to the bottom of the sea.

Now, all we need to do is add the animation that makes our fish swim!

So, in the Illustrator file are two paths that we’ve put on layers: orangePath and greenPath. They both have no fill and no stroke.

Here’s how they look in code:

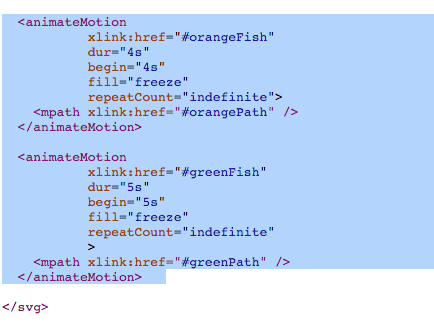
We want the orange fish to move along orangePath. We want it to begin at 4 seconds, and take 4 seconds to complete. We want that to repeat indefinitely. Here’s the code that would do that:

<animateMotion
xlink:href=”#orangeFish”
dur=”4s”
begin=”4s”
fill=”freeze”
repeatCount=”indefinite”>
<mpath xlink:href=”#orangePath” />
</animateMotion>

We want almost identical code for the green fish. We want the green fish to move along greenPath. But we want it to start a second after the orange fish, and have the green fish swim a little slower. So with this tag, we want it to begin at 5 seconds, and take 5 seconds to complete. We want that to repeat indefinitely. Here’s the code that would do that:

<animateMotion
xlink:href=”#greenFish”
dur=”5s”
begin=”5s”
fill=”freeze”
repeatCount=”indefinite”>
<mpath xlink:href=”#greenPath” />
</animateMotion>

Now we just need to add that code to our file, starter.htm. In the past examples, we have been adding tags inside g tags. These animateMotion tags, though, will be placed outside of any g tags. These will be pasted before the closing svg tag.
And that, friends, is how to animate an SVG.

I found that I had to adjust my Illustrator file and resave it to SVG a few times to get the positions just right. The first few times, I had my fish too low, then too high, just a hair too right, etc. Having to toggle between Illustrator and a text editor was cumbersome, and that’s a complaint I’ve heard on a few different SVG podcasts.

When I made this, I got a lot of the code from examples I Googled. This example from CSS-Tricks was especially helpful, as it was where I got the code for how to animate something on a specific path.

There’s a lot more, of course, but that page has a great overview to get started.

“Should journalists learn code?” Well, what exactly do you mean by “code”?

There have been many blog posts and articles that pose what has become a divisive question: Should journalists learn code?

There’s a lot of passion in the comment sections on these posts, but I’ve wondered if we’re all on the same page as to what the question means.

“Should journalists learn code?”

What do we mean by “code”? Do we mean HTML and CSS, which are markup languages? Or do we mean languages such as JavaScript and jQuery? Or do we mean Ruby? Python? C++? Journalists who don’t know what they don’t know might be tempted to lump everything together, but they’re not all the same.

What do we mean by “learn”? Do we mean learn everything until we are masters? Do we mean learn enough to be proficient? Do we mean that we should learn some of the basic concepts so we can follow conversations with our colleagues about projects?

Does this mean everyone should learn the same skills? Should reporters, editors, developers, photographers and graphic artists all learn the same programs and languages? Should they all be proficient at an expert level?

“Should journalists learn code?” will mean different things to different journalists, and the anxiety that question brings with it also brings valid concerns. Many journalists equate that question with completely changing their job. Some could think of it in terms of web galleries and managing assets on a web site. Some have told me they think of code as high-level computer programming and thus think of it as losing any aspect of reporting or editing in their jobs to instead solely write code. Others have not-unfounded worries that some newsrooms could farm out more work to fewer people. In other words, they muse, if journalists have to take on more work, and even different kinds of work, how can they do any of it effectively?

These are the concerns of many journalists, and thus we have been asking the wrong question all this time. There’s a better question to ask than “Should journalists learn code?”

The better question to ask is, “How can journalists use technology to be better at their jobs and to make their jobs easier?” A follow-up question can be, “How can markup and/or coding languages help journalists be better at their jobs and to make their jobs easier?”

These two questions are intentionally open-ended, and hopefully have a much more positive spin to them. It doesn’t imply changing your job or having to learn MIT-level technology. “Technology” doesn’t have to necessarily mean “code.” Any journalist who’s used Excel or Google Refine has used technology to make his or her job easier.

This question does not have any one right, binary answer, because each journalist will need different technologies for different reasons based on what his or her job is. As a person who makes interactive graphics, it behooves me to stay on top of the best practices for jQuery and JavaScript. But I don’t expect our metro columnists to feel the same need to master jQuery and JavaScript. They might scrape data, clean up spreadsheets or use coding languages with their reporting, because that can make their job easier.

“Should journalists learn code?” makes people defensive. They get their guards up and lose track of the ways they can mine data and use it to make their projects richer.

Here are examples of how I’ve integrated technology into my workflow to make things easier for me:

*When making bar charts in Illustrator, I never manually type the data values for the bars. I copy the chart, and modify that copy so that the text of the values appear. I ungroup that chart and voila, I have labels without me having to risk typing a typo.

*We tend to make a lot of color-coded maps, so I created templates in Illustrator of the maps we use the most: US, Massachusetts towns, Boston neighborhoods, etc. I saved those as SVGs and then turned those SVGs into HTML. That was just a few clicks and typing of lines. The heavy lifting was writing code for a map generator that would allow me to copy and paste spreadsheet data to color-code the maps for me. It took some time, but it paid off. It creates responsive maps that I can easily pluck onto the website, but I can also print-to-PDF those suckers and have the basis for the print version. People who have made vector maps will know that the “old way” of having to select each state/county individually to color-code it was a pain the ass. And fraught with the possibility of introducing error.

*When working on web projects, I almost always use spreadsheets. Lately I’ve used Google spreadsheets so that reporters and editors can make changes. I then use Mr. Data Converter to turn that spreadsheet into a JSON and then write the JavaScript/jQuery that will cycle through that data and write out HTML for me. I do that rather than having to copy and paste things, because it’s ultimately easier and because copying and pasting things into divs leaves the possibility of pasting in the wrong place.

You might sense a theme in those three examples: All three of them are processes I’ve adopted so as to minimize or eliminate errors. Cutting down on errors is good for us, our bosses, our readers and our sources. It’s good for everyone. Using technology to help me do that was worth any of the effort I put into it. It also taught me skills that allowed me to help colleagues in ways I hadn’t been able before.

The web is to our culture now what water is to a fish. If we ignore the basics of how the web works, we do so at our own peril. The more tools we have in our toolbox, the more our projects will benefit. A reporter who pores over public records could do well to understand how to scrape data from web sites. That same reporter could benefit from knowing how to clean up data, either through Excel or Google Refine.

Given the choice between two equally talented writers, I would bet news organizations want people who can do more with the web, not less with it. It’s going to be hard to find a journalism job posting that doesn’t want someone who has at least a basic understanding of general web concepts. No, that does not mean that reporters will need mastery understanding of HTML, CSS and JavaScript to get a job. But if the reporter is going to be working with designers and developers who will take that reporter’s story and turn it into a web presentation, shouldn’t the reporter at least have a broad understanding of what those people do? The reporter doesn’t need to know how to do those other jobs, but should at least know some of the challenges, including that the way a web page looks on a desktop is not necessarily how it looks on a mobile phone.

Reporters are good at researching the processes and terminologies of the organizations they cover, whether it’s a basketball team or a school board. A good tech reporter doesn’t have to be able to build the technology he’s covering, but he at least should be able to know enough to follow along when talking to sources and then be able to explain the important parts to readers. We should have that same mindset in our newsrooms. A reporter and a developer working on a big web project together will have different roles on that project, but they should at least communicate what they need from each other and how they can help each other most effectively.

How BostonGlobe.com’s gay marriage interactive graphic came to be

Today is the first day that Hawaii allows same-sex marriage. The state was the 16th to approve allowing gay marriage, and becomes the 15th to begin performing them. Illinois’ state legislature approved same-sex marriage a few days before Hawaii, but that law won’t go into effect until summer of 2014.

For the last four months, I have been editing and updating this BostonGlobe.com interactive graphic about the history of same-sex marriage in the United States. In short, there’s a sticky navigation that stays with you when you scroll through the timeline, show maps and tallies that change as states allow gay marriage, ban gay marriage or allow civil unions or domestic partnerships. The timeline includes links to archived stories, copies of bills and statutes, and PDFs of past Globe front pages.

The landscape as of 1996:

As of the 2004 election:

As of today, when Hawaii becomes the 15th state to allow same-sex marriage:

This sticky bar is just part of the graphic, of course, as the timeline is what triggers the changes in colors.


—————————


HOW THIS STARTED

I conceived this project right after the Supreme Court ruled on Proposition 8 and the Defense of Marriage Act. In the days that followed, we had many stories about what impact these rulings could bring. These stories usually included maps that more or less looked like this:

Those maps can be tricky to read, because they cram five different types of states into one map:
*States allowing gay marriage
*States allowing civil unions or domestic partnerships, but not gay marriage
*States banning gay marriage by constitutional amendment
*States banning gay marriage by constitutional amendment, but allowing civil unions or domestic partnerships
*The default states, not identified, which have no constitutional reference to gay marriage

These maps are helpful to glean the overall splintering of the issue, and can be used to parse out laws state by state, but are still busier than need be. I wanted was something easier to read, and after talking with Boston Globe AME for Design Dan Zedek, I decided three separate maps would work best. But even then, I thought the map alone didn’t show how much the map has changed over time.

To truly get at the heart of the story, I thought, we needed three interactive maps that changed over time.

It was late June and I set myself an August 1 deadline. I picked that date because that’s when Rhode Island and Minnesota would begin performing same-sex marriages.

So, I set to work on a variety of tasks:
*Researching gay marriage laws and milestones, both on national and state-by-state levels
*Compiling links of past stories on the milestones, both to add to the timeline and to CQ the dates I had found
*Compiling photos from those events
*Building the framework for this responsive graphic using jQuery, JavaScript and CSS
*Testing it to see where it broke
*Refining, revising, refining and more revising

As I revised this, former Boston Globe Graphics Director Javier Zarracina was very helpful in giving me advice on tweaking the design. He was also very accommodating in giving me the time to work on this project.

—————————


HOW THIS EVOLVED

I reached the August 1 deadline.

For the Metro section of the paper that day, Boston Globe Assistant Design Director for News Robert S. Davis conceived a tease graphic that could anchor the page and promote the online graphic:

Once I launched this on August 1, I would update this whenever new developments occurred. The summer and fall of 2013 saw a bunch new developments, of course, as federal agencies and state agencies began changing policies to be inclusive of married same-sex couples. I ended up having more than 100 events on the timeline. Thus, per the suggestion of Robert Davis, I divided the news stories into “key events” and “other.” The page now loads with only the key events, but the sticky nav with the maps includes a link to click that shows all the events.

This project has spawned the most unwieldy-looking Excel file I’ve ever used:

I mean, just looking at that gives me a headache.


—————————


HOW THIS TECHNICALLY WORKS

Using Shan Carter’s great resource, Mr. Data Converter, I turned that beast of an Excel file into a JSON file. The jQuery reads that and appends a main div on the page with a div for each event, including nested divs for the headline, the text, the photos, the captions and the links.

The maps are SVG, taken from a template that Chiqui Esteban created for our department. When the timeline is scrolled through, the color and tally changes are triggered by div IDs when those IDs are near the top of the screen.


—————————


HOW I FIND STORIES FOR THE TIMELINE

The obvious ones — “Illinois to approve gay marriage,” for example — present themselves. The less obvious ones come from the AP wire, Google searches and a great app that has been invaluable in this process.

Zite functions like Google News in that you can have personalized categories for your news feed. Furthermore, it lets you give a story a “thumbs up” or “thumbs down,” like Pandora.

I check Zite throughout the day, particularly on its feed for “Same-sex marriage.” It often has things that are on my radar, but it has also allowed me to find stories that I wouldn’t have known were coming.

Gay news blogs have also been invaluable. I never source a gay news blog, but I will often follow their links to news sources that I can source: The Associated Press and other newspapers. In the same vein, Twitter has also been a good way to find stories. The #gaymarriage hashtag brings up a lot of opinions, but it has helped me find stories in other states.


—————————


WHAT’S NEXT
What’s next is that I’ll keep updating this as gay marriage news continues to happen. Naturally, you’ll need to check BostonGlobe.com to see the updates.

INFOGRAPHIC: ‘Golden Girls’ to ‘Desperate Housewives’

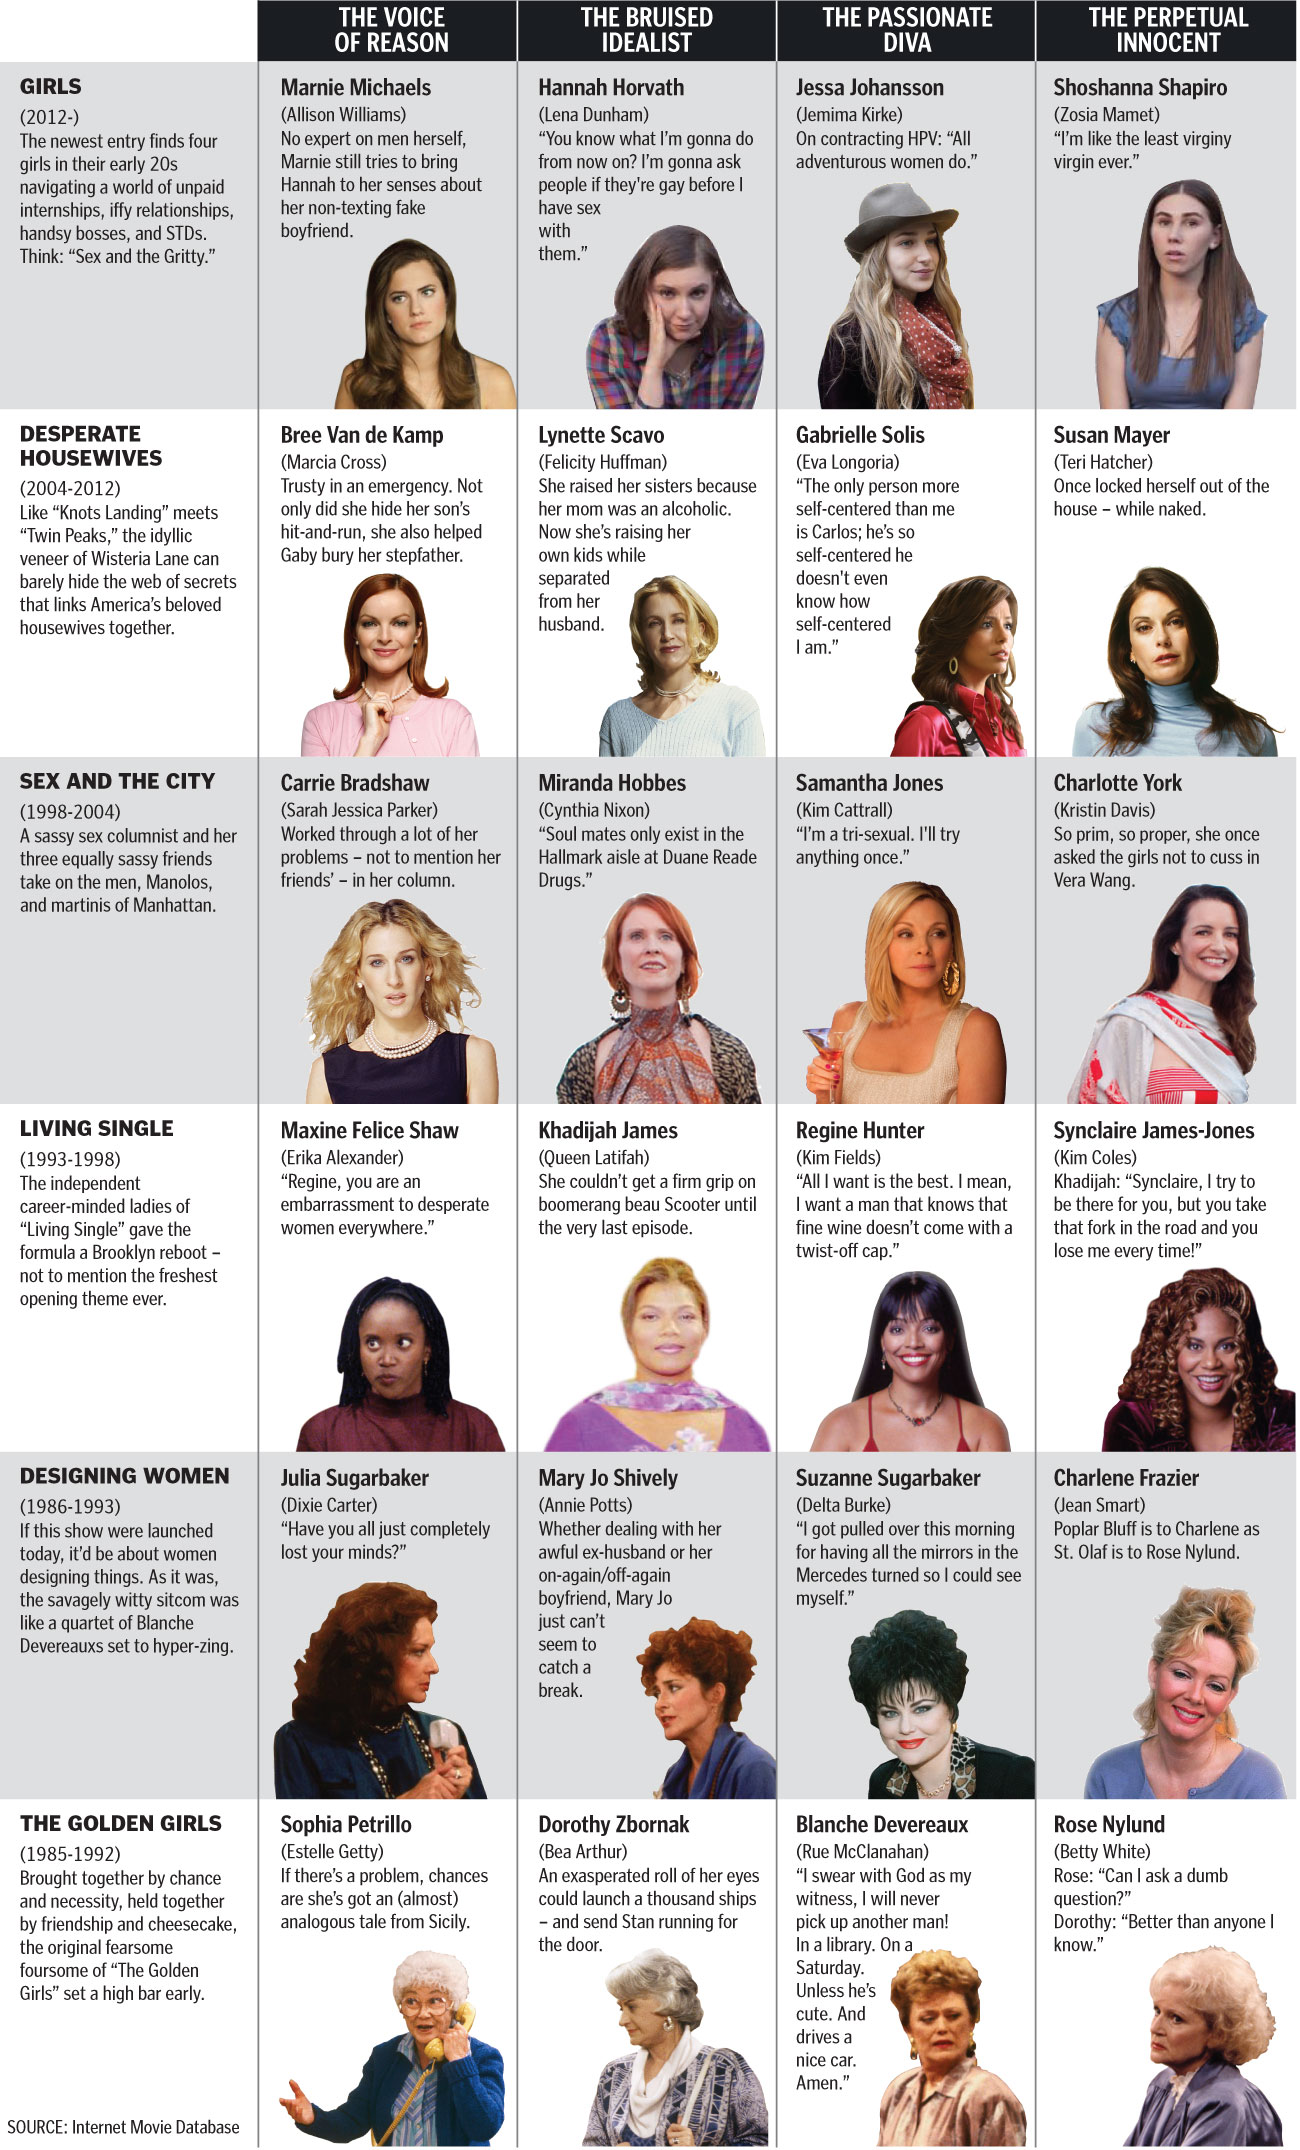
Sunday’s series finale of “Desperate Housewives” provided me and my colleagues at The Boston Globe the opportunity to create a graphic showing how the show fits in with other TV shows with female foursomes. The concept was simple: “Desperate Housewives” is going away, but the archetypes that defined each character has been around on TV for a while, at least since “The Golden Girls.” And seems to continue with the new show, “Girls.”

Here’s the chart that ran on Sunday’s Arts section of The Boston Globe. Click for a larger view.

Boston Globe chart comparing Desperate Housewives, Golden Girls, Sex And The City, Hot In Cleveland, Living Single, Designing Women, Girls


Click on the links to the BostonGlobe.com version and the Boston.com version.

––––––

HOW IT CAME TOGETHER

I had a professor who taught me several important things, but two things are important for this graphic:

  1. Anything can inspire an information graphic, whether it be a press release or a musing you have at a coffee shop.
  2. The characters in “Sex And The City” are perfect counterparts to the characters in “Golden Girls.”

In the years that have followed, I realized he was right. First, anything can lend itself to a graphic. I have several graphics in my portfolio that started out as conversations. I blogged last summer about a chart using the archetypes described in Joseph Campbell’s “The Hero With a Thousand Faces” to compare characters from the Harry Potter series, “Star Wars” and other franchises. It was a great blending of some of my favorite things: academic-minded critiques, pop culture and infographics.

Just as that graphic started with me talking about how Harry Potter was similar to other movies, this “Desperate Housewives” chart started with me talking with friends. I repeated my professor’s statement that the “Sex And The City” characters were very similar to the “Golden Girls” characters. When I’d tell this to people, they’d instantly see that Samantha was Blanche and that Charlotte was Rose. But what about Carrie? Was she Dorothy or Sophia? There were compelling arguments that she was Dorothy and Miranda was Sophia, but just as many people said Carrie was Sophia and Miranda was Dorothy.

Around this same time, “Desperate Housewives” premiered on ABC. I immediately watched, because it had not one but TWO “Melrose Place” alums: Marcia Cross and Doug Savant. I was hooked on this show that seemed equally inspired by “Knots Landing” drama, John Waters’ campiness and “Twin Peaks”-style darkness.

As it became apparent that this would be the last season, I came up with several graphic possibilities for the end of “Desperate Housewives.” The idea of viewing the show in a broader context seemed most appealing, because I knew that something too focused on the show wouldn’t get any play. I began to wonder how the ladies of Wisteria Lane fit in with “Golden Girls” and “Sex And The City.”

I floated the idea to a few people to test their interest. The debates were pretty good, and I realized I had a winner on my hands. I didn’t know if it would be something that the Boston Globe wanted, so I initially pitched it to Boston.com. I ended up getting several e-mails that indeed this could have a home in print and online.

FITTING IT ALL IN

The more I talked with editors, it was apparent that we could use several shows in this graphic. “Designing Women” had a similar formula, as did Betty White’s new show, “Hot In Cleveland.” “Girlfriends” and “Living Single” seemed to line up with this, as did “Noah’s Arc,” which was about four gay black men in Los Angeles. But if used shows about men, would we also use “Entourage”? It could become very unwieldy.

The solution was to run six in print. We cut “Hot In Cleveland” from the print version and instead used “Girls” as the modern show. But we kept “Hot In Cleveland” for the web versions. Michael Brodeur took my original text and punched it up, giving it some flair and humor. I had never seen “Girls,” so he helped identify which categories fit which characters.

I created two web versions, because this would live on both BostonGlobe.com and Boston.com. The sites have different palettes and styles, of course, but there’s another hitch. I had to design the BostonGlobe.com version responsively, meaning that I had to make sure it could be viewed (and readable!) on any browser, on any platform, on any screen, at any size.

You saw the chart at the top of the page. How can that be read on a mobile device?

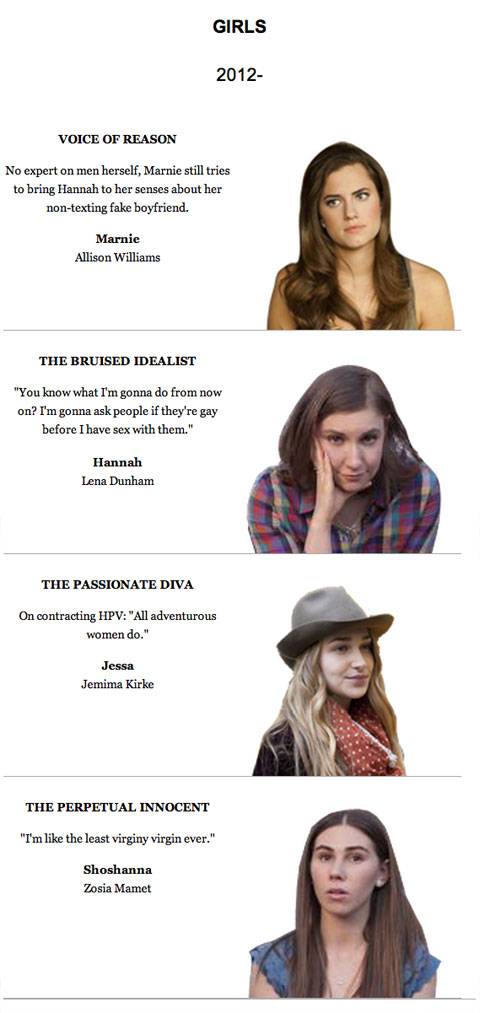
Here’s how one of the TV shows would appear on the iPhone’s portrait view of the BostonGlobe.com version:


And here’s how a show would look in the iPhone’s landscape view, or on some tablets:

On larger screens, it appeared the way it did in print: as a full grid.
Click on the links to the BostonGlobe.com version and the Boston.com version.

Do we have “brands”? Or just reputations for our work?

A question I’ve struggled with recently is whether journalists have “brands.” I’ve heard that term a lot in the last year, at conferences and on websites, and I’m not always sure what to make of it.

I used to cringe when hearing that term. To me, it was a gimmicky word for marketers and advertisers that had no place in the sacred world of journalism. I, and other journalists like me, drew a distinction: Disney, Wal-Mart and Fox have brands, but we were just people. We were people who worked hard and wanted to be known for doing our particular jobs well, but we were just people.

But Joe Grimm, the guy who became known for the Jobs Page and “Ask The Recruiter,” changed the way I viewed the word “brand.” A few months ago at SND STL, he lectured a session called, “Building Your Digital Brand.” His overall message that was that your “brand,” if we call it that, is what you’re known for, and not some image that you manufacture.

If I and other journalists seem sensitive about the term, it’s because we’ve felt under scrutiny for wanting to promote our work. A few months ago, Gene Weingarten of The Washington Post wrote a column about journalists and brands.

Weingarten wrote the column as a letter to a reader named Leslie, who chose Weingarten as the subject of her journalism school graduate thesis. Weingarten writes:

The best way to build a brand is to take a three-foot length of malleable iron and get one end red-hot. Then, apply it vigorously to the buttocks of the instructor who gave you this question. You want a nice, meaty sizzle.
These are financially troubled times for our profession, Leslie — times that test our character — and it is disheartening to learn that journalism schools are responding to this challenge by urging their students to market themselves like Cheez Doodles.

And later, when talking about modern journalists…

Now, the first goal seems to be self-promotion — the fame part, the “brand.” That’s because we know that, in this frenetic fight for eyeballs at all costs, the attribute that is most rewarded is screeching ubiquity, not talent. It is why Snooki — who is quite possibly literally a moron — has a best-selling book. It is why the media superstars of today are no longer people such as Bob Woodward, who break big stories, but people like Bill O’Reilly, who yell about them.

Yikes. That column made me never want to use the word ever again. But Weingarten’s missive also kind of confused me, because I didn’t think it was bad for journalists to share their work. It gets shared in thousands of newspapers a day, so why is it so bad to group it together in one spot on the Internet? When I need ideas and inspiration, I love looking at other journalists’ portfolios. To me, having your work in one spot to share with other journalists (and potential future employers) was a good thing. Certainly not worthy of the hot poker.

Maybe it’s the word “brand” that bothered him. Because it certainly bothered me. But if Joe Grimm and other journalists are just using the word to represent your skills and work for which you’re known, then is there less fuss? Grimm even pointed out that Weingarten himself has made a name or “brand” (gasp!) for himself and that’s why he’s so valuable to The Washington Post. When you read Weingarten, you know what you’re getting and you probably read it (or don’t) because you know what you’re getting.

And it’s occurred to me that’s been true about several journalists I’ve admired over the years:

  • Mike Royko
  • Lewis Grizzard
  • Brian McGrory
  • Bill McClellan

I like all those guys, but not because of the mystique behind the name, but because I like the work they do.

Which was exactly Joe Grimm’s point:
“You don’t try to brand yourself. The thing that does it is the work. And it has to be real and authentic.”

Think of it this way. Let’s say you’re looking for a graphics person who can also illustrate. You’ll start listing the names whom you know can do what you want, and then you start comparing those people’s portfolios to narrow it down. Then, you’re no longer talking about names, but rather the work and skills that defines those names.

Knowing what you’re good at doing is important as news organizations struggle to stay afloat and rethink their strategies. Grimm says:

“It’s not enough to be good. You have to be good in a remarkable way…
…You need to be good, and you need to be good in a remarkable way, and it has to be a valuable way.”

And why does Grimm suggest this? So that you can do more good work. When I think of it that way, and don’t use the b-word at all, I think I get it.

RELATED
11 tips for journalists who want their own website

4 reasons why Adobe Flash was not a waste of our time

Last week, Adobe Systems announced it would stop making Flash technology for mobile devices and would instead focus on HTML5.

Flash’s end has been predicted for the last few years now, as it is not supported on the iPhone or the iPad. Flash runs on other mobile devices, but Apple products are the Marcia Brady of their kind. If Apple rejects you, you’re kinda sorta screwed.

4 reasons why Adobe Flash was not a waste of our time

For many graphic artists who joined newsrooms before the big push for “interactive graphics,” Flash was the first program we used to make web graphics with rollovers. We struggled with the differences between frames and keyframes. We learned that changing a movie clip changed every instance of the movie clip. We cheered when we figured those things out, and then were challenged when we transitioned from ActionScript 2.0 to 3.0.

Don’t take that as a complaint. Journalists pride themselves on being problem-solvers whose job is learning new things. With interactive graphics, there was (and still is) always something to learn. Flash, to me, embodies how a lot of people in newsrooms feel: no matter how fast you try to catch up, there’s always something newer to learn.

Earlier this year, I got to attend SND STL. While there, I met a lot of graphic artists who felt frustrated by Flash’s imminent obsolescence. One guy put it best: “I feel like I spent the last three years trying to learn this program, and now that I’m somewhat proficient, it’s useless. I feel like I wasted my time.”

But I don’t think he wasted his time. Here are a few reasons why:

  1. It was a decent gateway for people who had never coded before. Flash allowed you to create things the way you were used to creating them in Illustrator. Using ActionScript, you could make those objects do things. ActionScript won’t work in HTML or JavaScript, but the general concept is the same: you have code that dictates what the package looks like and how the user will interact with it. ActionScript and JavaScript are not the same but they have similar structures. You can’t waltz from one into the other, per se, but knowing one could help you grasp some of the basic concepts.
  2. It forced some people to learn HTML and CSS. When you finished your Flash file, you had to export it as a SWF. To put that on a web page, you still needed to write code that said, “Hey, show this Flash file.” If you had never used HTML before, having to embed your Flash movies might have been your introduction to basic CSS and HTML.
  3. You proved you could adapt. Remember when we all had to switch from FreeHand to Illustrator? Or ActionScript 2.0 to 3.0? There were quirks and growing pains, and you might have complained that you shouldn’t have to learn this stuff. But you did it. So what if Flash is no longer used by many organizations. The take-away is that you have proven that you are willing to invest time to learn whatever the new technologies are. Spin it that way, and your Flash knowledge makes you look like a hard worker who can try new things, rather than some dinosaur.
  4. Understanding the philosophy behind what makes a good interactive graphic is just as important as knowing the specific technology. Page designers who made good pages in Quark figured out how to make good pages in InDesign. The fundamentals of page design didn’t change when we switched from Quark to InDesign. The fundamentals of good information graphics didn’t change when FreeHand was replaced in newsrooms by Illustrator.

The Nieman Journalism Lab had a good piece about how Adobe’s abandonment of Flash will affect the news organizations who used it. If you haven’t seen it, please do.

And then start on your HTML5 tutorials. There are interactive graphics to be made.

My moot point against Rick Springfield and “Jessie’s Girl”

Happy Birthday to Rick Springfield, who turns 62 on Tuesday. He is best remembered for his 1981 song, “Jessie’s Girl.” And best known to my friends as the guy who spawned my now defunct war on the word “moot.”

When I was a copy editing intern, my friend and I bonded over stories of our favorite pet peeves and word misuses. I had the pedestrian ones everyone has: “their/there/they’re” and “you’re/your.” But my friend one-upped me with her distaste for Rick Springfield and his use of the word moot.

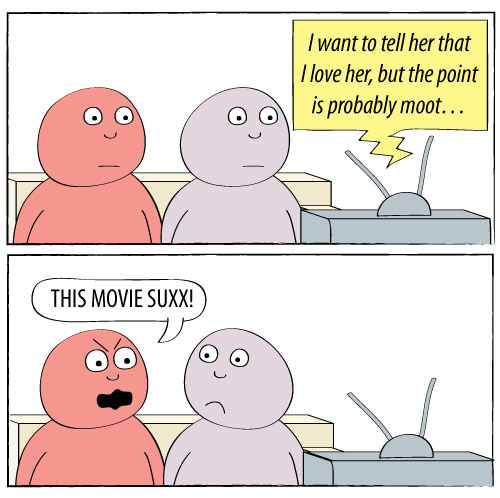
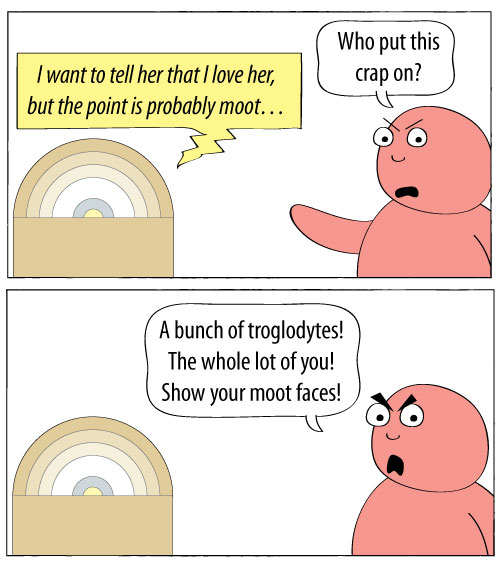
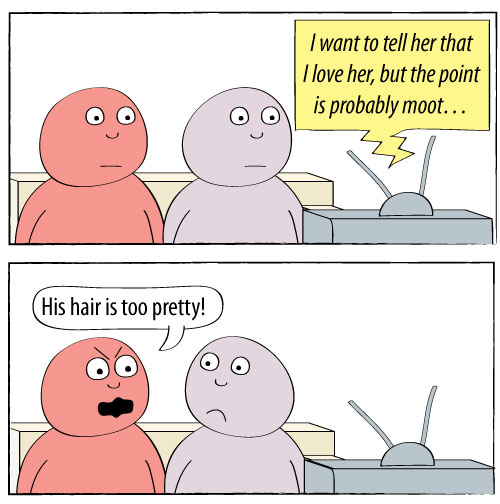
I was intrigued. Why would this bug a copy editor? In the song, Rick declares his love for his friend’s girlfriend. He says, “I want to tell her that I love her, but the point is probably moot.”

That use of the word is acceptable in the vernacular, but according to Merriam-Webster, the word has two meanings:

  1. open to question : debatable : subjected to discussion : disputed
  2. deprived of practical significance : made abstract or purely academic

Similarly, the definitions from the OED:

  1. Originally in Law, of a case, issue, etc.: proposed for discussion at a moot (MOOT n.1 4). Later also gen.: open to argument, debatable; uncertain, doubtful; unable to be firmly resolved. Freq. in moot case, [moot] point.
  2. N. Amer. (orig. Law). Of a case, issue, etc.: having no practical significance or relevance; abstract, academic. Now the usual sense in North America.

“Jessie’s Girl” used the word in its second meaning: not worth debating, already decided, irrelevant, etc. But that wasn’t the FIRST definition given in the dictionaries, and upon later, research, it wasn’t necessarily the original definition of the word.

According to TheFreeDictionary.com:

The adjective moot is originally a legal term going back to the mid-16th century. It derives from the noun moot, in its sense of a hypothetical case argued as an exercise by law students. Consequently, a moot question is one that is arguable or open to debate. But in the mid-19th century people also began to look at the hypothetical side of moot as its essential meaning, and they started to use the word to mean “of no significance or relevance.” Thus, a moot point, however debatable, is one that has no practical value. A number of critics have objected to this use, but 59 percent of the Usage Panel accepts it in the sentence The nominee himself chastised the White House for failing to do more to support him, but his concerns became moot when a number of Republicans announced that they, too, would oppose the nomination. When using moot one should be sure that the context makes clear which sense is meant.

Back then, we zealous 22-year-old copy editors thought that the first definition should be the primary definition and that it must be Rick Springfield’s fault for the opposite definition. In our minds, the word had meant  “disputed, debatable and open to discussion” until the very moment he released “Jessie’s Girl” as a single.

From that moment on, I adopted my friend’s dislike for Rick Springfield. I disparaged him whenever I heard him.

On a movie soundtrack…


On a jukebox…

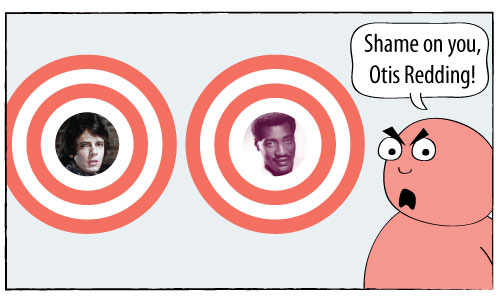
This went on for about four years. Then, I became more accepting of the changing nature of words. Many people will say “podium” when they mean “lectern.” “Presently,” which meant “in the immediate future,” became an acceptable substitute for “currently.” If we were really sticklers for word use, Otis Redding’s “(Sittin’ On) The Dock Of The Bay” would really be “(Sittin’ On) The Pier Of The Bay.” The dock, which can mean “landing pier,” also means the water right around the pier.

But we’ve forgiven those deviations and have even incorporated them into our language. And, as language evolves, it’s important to recognize what people will understand and won’t understand. If most people know “moot” to mean “irrelevant” and “not debatable,” then I’m fighting a losing battle if I try to use the original meaning. Language evolves, and so I had to evolve as well.

So I had to find another reason to mock Rick Springfield.

For more on the word “moot,” check out this blog post on Talk Wordy To Me.

20 years after “black album,” Metallica’s platinum records compared

It was 20 years ago this week, on Aug. 12, 1991, that Metallica’s self-titled fifth studio album was released. In the two decades since its release, the “black album” has become Metallica’s defining album. It is certified 15X platinum, far above any other studio album by the band.

Five years later, the band teamed up once again with Bob Rock, the producer of the “black album” (so named for its black cover). “Load,” Metallica’s sixth studio album, was released in the summer of 1996. Hardcore fans said that the band had “sold out.” Some said it was because the band members had cut their hair. My friend Ned felt conflicted buying “Load,” but I told him that his long hair made up for their sins of cutting their glorious manes.

Anywho, for the 20th anniversary of the album that spawned “Enter Sandman” and “Sad But True,” I thought I’d look up the band’s platinum certifications on Recording Industry Association of America’s website. Using the RIAA’s listings, I created the following chart of when the band’s nine studio albums were certified platinum, double platinum, triple platinum, and so on.

Of course, another way to compare how many times each album went platinum would be to use bars. Here is each album and its number of platinum certifications, by order of release:

What can these charts tell us?

  • The “black album” is definitely the Metallica’s biggest commercial success. Add up the number of platinum certifications for all the studio albums they’ve done since and you won’t still won’t match it.
  • The band’s platinum certifications increase with each album through the “black album” and then decrease with each album after that. Of course, all of this is with the hindsight of 20 years. The newer albums might eventually be certified platinum again after they’ve been “out long enough” to catch up with the others. I’m not sure that will happen, though.
  • In the 2000s (whatever that decade is to be called), the Metallica albums that continued to get certified had been released between 1984 and 1991.
  • The post-“black album” records see an initial jump but don’t continue getting certified the way that the other non-“black album” discs do. Again, those older albums have been out a lot longer, so they have had the time to climb steadily.

Another thought

Bob Rock produced that record and every studio album through “St. Anger” in 2003. They used a different producer for “Death Magnetic,” which a lot of die-hard fans think is the best in 20 years. My theory? Fans who gravitated toward the unpolished sounds of the first four albums liked that familiar style in “Death Magnetic.” “Metallica” had a lot more polished sound and each album sounded cleaner and cleaner. “Death Magnetic,” though, sounds like it’s going to rob you, knife you and then eat you.

Of course, maybe it’s simpler than that. Maybe it’s not Bob Rock, the band members’ hair or any of that. Many bands or artists have that classic album to which fans will compare every other album that band or artist will release. For Metallica, it’s the “black album.” Those guys could cure cancer and some headbanger would say, “That’s good and all, but it’s no ‘black album.'”

Harry Potter, Star Wars, Joseph Campbell and the hero myth

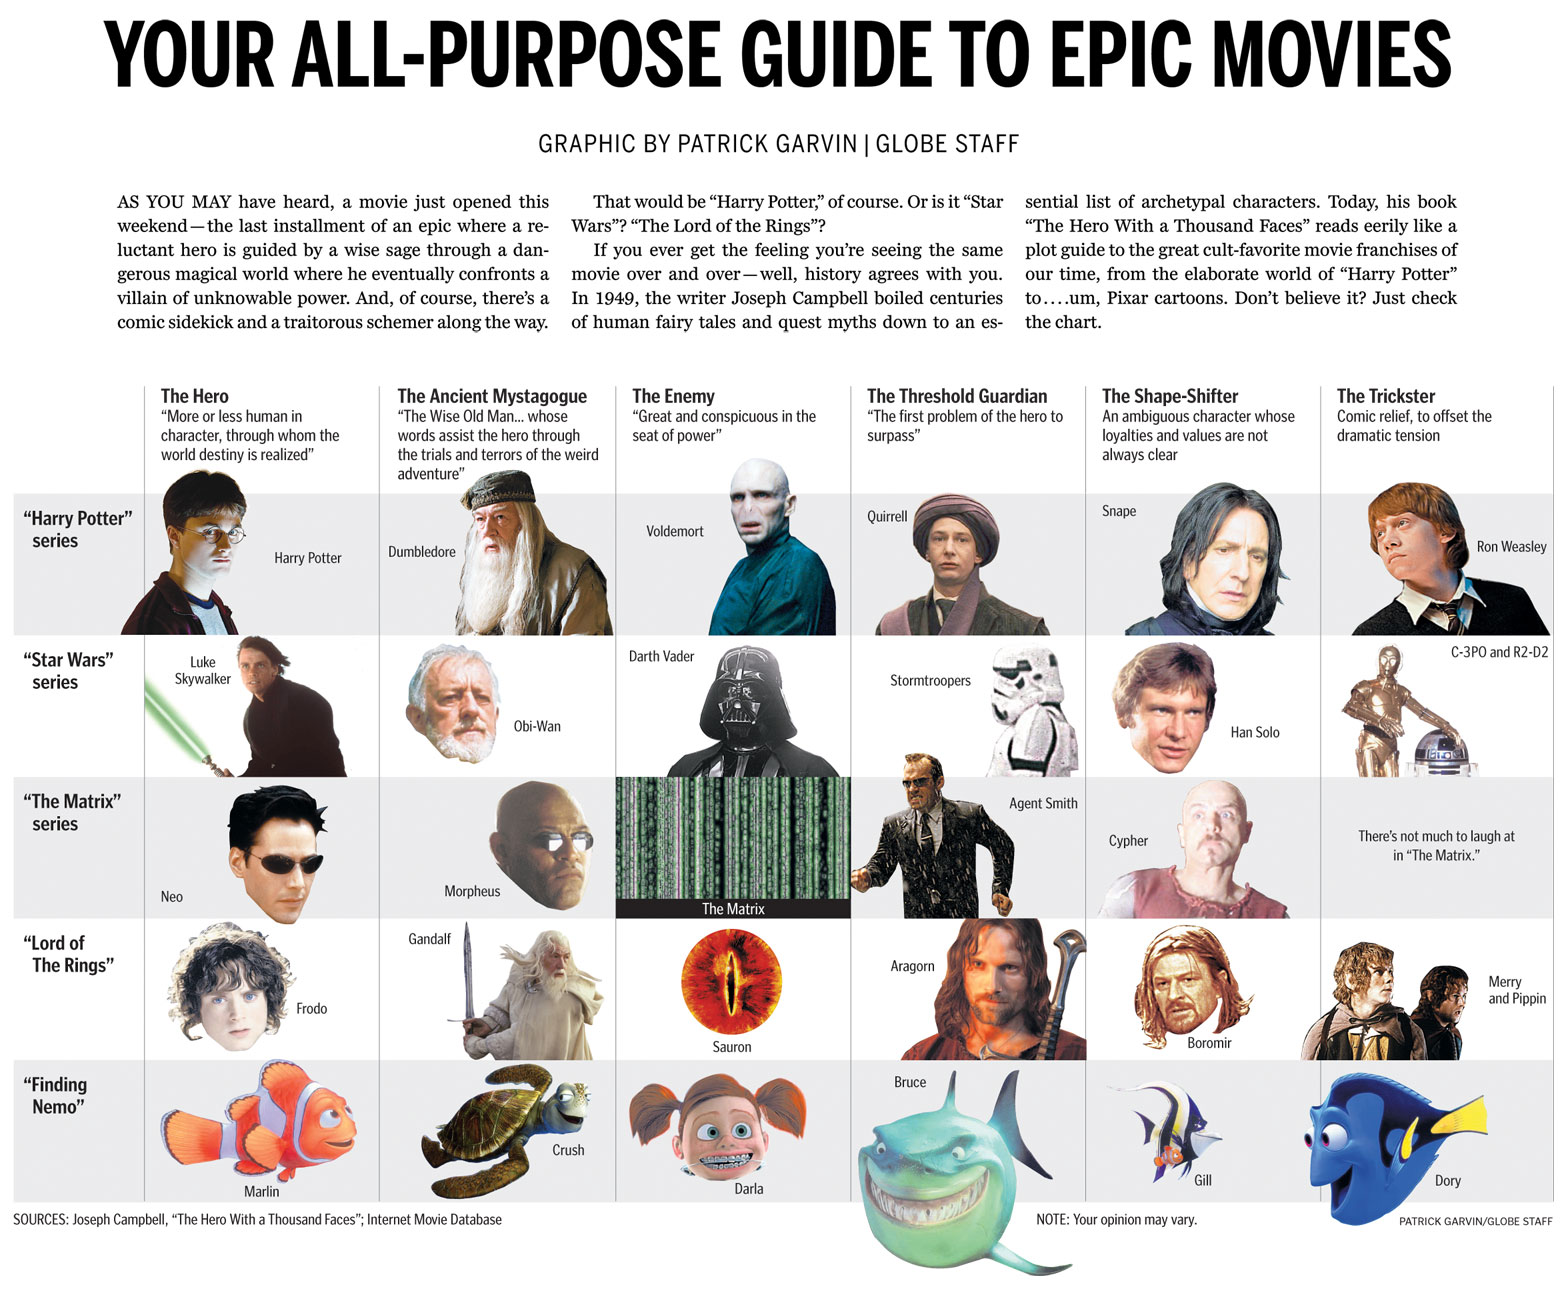
I wanted to share with you a chart from the Ideas section of this Sunday’s Boston Globe. Using the archetypes described in Joseph Campbell’s “The Hero With a Thousand Faces,” the chart compares characters from the Harry Potter series, “Star Wars,” “The Matrix,” “Lord Of The Rings” and… “Finding Nemo.”

Click for a larger view.

Boston Globe chart comparing Harry Potter, Star Wars, The Matrix, Lord of the Rings and Finding Nemo using Joseph Campbell hero archetypes

HOW IT CAME TOGETHER

I’ve long kept a graphics notebook in which I jot down and scribble ideas as they occur to me. I’m currently on the fifth notebook.

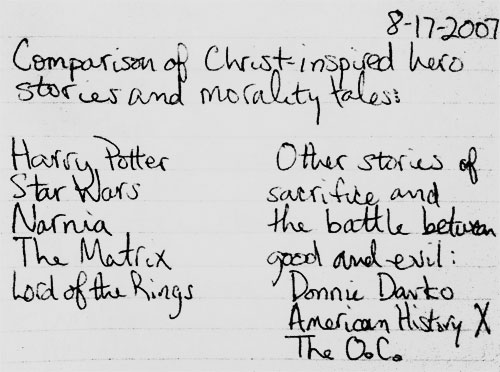
In the summer of 2007, I caught up with the world and finally began reading the Harry Potter books. I started a month or so before the final book was released. Thus, I got to start with the first book and read the entire series without pausing in between books. The day I finished the seventh book, my mind was racing with ideas. Once such idea:

I jotted whatever came to my mind, knowing I could edit it later. I had long seen the similarities in other sci-fi and fantasy movies, as I had some teachers in high school who riffed on those concepts in class. The idea sat in the notebook for almost four years. (Note to those who know me: check the date on the top of the notebook entry.)

Flash forward to this current summer, four years and one newspaper after I first read the Harry Potter books and had the idea. Colleague Ryan Huddle was working on his great Harry Potter treatment, which you can read about on Charles Apple’s blog. Dan Zedek, AME for Design, asked if I might have any ideas for “The Deathly Hallows,” as he had seen what I had done for the last Indiana Jones movie. I told him about the aforementioned notebook submission, and added that we didn’t have to focus solely on Biblical characters. We could open it up to the hero archetypes explored by Joseph Campbell, who literally wrote the book on the topic.

The next day, Dan told me he had run the idea by Steve Heuser of the Ideas section. Steve had thought the idea had potential and wanted me to rough up some notes to use as a jumping-off point. I consulted assistant graphics editor Javier Zarracina, who was a wealth of ideas. We looked up the hero myth structure, which can be very simple or complicated, depending on who’s dissecting Joseph Campbell’s books and lectures. Additionally, I am especially indebted to Mike O’Brien and Rob Bergman from DeSmet Jesuit High School in St. Louis, as they gave me tons of ideas and sites to consult.

Working with Steve and Javier, I tightened the focus to the archetypes and left out the comparisons of plot. I used Harry Potter, “Star Wars,” “Lord of the Rings” and “The Matrix,” but decided to leave off the Narnia movies. For one, I had only seen the first movie, which hadn’t had the same mass appeal as the others on the list. Steve suggested we try to find a movie that used the same archetypes but that deviated from the serious sci-fi/fantasy realm. I suggested “Finding Nemo,” and he laughed so hard that I knew we had a winner.

I originally structured the chart in a rather traditional, straightforward way. Steve suggested I use the whole width of the page, and Javier suggested I cut out some of the photos using silhouettes. Lisa Tuite and Wanda Joseph-Rollins of The Boston Globe library both helped pull photos to use. Dan helped me vary the cutouts so that they seemed more dynamic. We tweaked and tweaked, and I liked each version more than the previous versions. The graphic ended up on Boston.com by Friday afternoon.

ABOUT THE MOVIES WE DIDN’T USE

There were a ton of movies we could have used, because there are a ton of movies that use these archetypes. Besides the Narnia films, both the “Batman” series and “The Princess Bride” were suggested, as were several westerns and Akira Kurosawa films. Many non-fantasy films were suggested, too. These were all great suggestions, and I thank all of you whom I e-mailed for advice.

Ultimately, Steve, Javier, Dan and I kept the list limited to big movies and series from the past 10 years or so. We could have easily done a full-page chart with more than a dozen films and still not even scratch the surface of the films who’ve used these archetypes. The whole point of this chart is that these tropes are ubiquitous.

In addition to the films we chose (or didn’t choose), readers might take issue with the specific characters we chose for the categories. Within the newsroom, we had lots of differing opinions. Ultimately, I think this shows we came up with a great idea that will have people talking. A “talker,” if you will. Or a “Hey, Martha.”

Working on this chart appealed to several of my geek loves: “Star Wars,” philosophy, Harry Potter and infographics. Dan frequently likes to tease me for my references to “Star Wars” and “Harry Potter.” If only I could have referenced Scrabble, “The X-Files,” “Battlestar Galactica” and “Melrose Place,” the Pat Garvin interests could have all been referenced.

Next time.

Del Taco, a flying saucer and a nostalgia for a past St. Louis

There’s a big kerfluffle in my hometown of St. Louis this week. A UFO-looking building, which until midnight was home to a Del Taco franchise, was presumably going to be demolished. The property’s owner didn’t think anyone would take the property and keep the building intact. The Board of Aldermen voted Wednesday on a bill that would provide tax abatement for whomever developed the property, and on Thursday, the bill’s sponsor added a provision to the bill that would force the demolition to go before the city’s Preservation Board. Still, the preservationists are skeptical that the building will be preserved.

It might be hard to understand the fervor for the building. Certainly there’s no fervor for the business within the building. The Del Taco franchise didn’t make much money. In December 2009, the independent operator who had been subleasing the building filed for bankruptcy. I would think that the people who cared about the Del Taco would have shown up by now. But in the weeks since the building’s possible demolition was announced, there have been Facebook pages, a petition and blogging campaigns to save the late-’60s era building.

Why? What’s so special about this building? I’ve had to ask myself that question a few times this week.

When I first heard that the flying saucer building on South Grand could be torn down, I felt a pang of nostalgia. It reminded me of when I was a kid, and I felt that was reason enough to save it. After some thought, I realized I had never even gone through the drive-thru there, let alone inside. I had been to the other Del Taco, but not the one in the flying saucer building. Thus, my only memories of it were seeing it as I drove into the cities from the suburbs.

But I had this righteousness that they shouldn’t tear down such a historic building. Of course, until I started reading about the building, I had no idea it had been built in the 1960s as a gas station. I had attached a sense of nostalgia to a place I only saw from a car. Why was this place so important? I didn’t even grow up in the city. I grew up in the county. And I haven’t lived there since 2000.

So, why am I and other kids from the suburbs suddenly following this on Facebook, with a sense of nostalgia for a building we hadn’t thought of in years? There are a few reasons at play, and only a few have to do with the building itself.

Photo by Laura Miller/Riverfront Times

Photo by Laura Miller/Riverfront Times

For starters, it is a cool building. It looks like a flying saucer, and is a testament to some of the interesting architecture that’s harder to find in St. Louis these days. Past has shown that interesting buildings don’t get replaced with interesting buildings. The Parkmoor was torn down for a Walgreen’s, the Arena was torn down for an office park. Historic architecture has been replaced with things that no longer distinguish the neighborhoods. You could have a Walgreen’s in Wentzville or an office park in Chesterfield, but you won’t find a flying saucer there.

St. Louis is a city with a fragile ego. The city as a whole is still smarting over the fact that InBev bought Anheuser Busch, which is one of several big companies that are no longer headquartered in St. Louis. There are people there who remember the days when St. Louis thought of itself in the same leagues as New York and Chicago. St. Louis had several major companies. St. Louis had four sports teams. St. Louis had a thriving downtown. That’s in the past, but it hurts, even for people who were born long after the city’s heyday. The inferiority complex has been passed down to generations. Quite simply, St. Louis is a Jan Brady — the overlooked middle sister — smarting over how it used to be Marcia, the pretty older sister who commanded attention.

In a column from July 2009 about “Meet Me In St. Louis,” St. Louis Post-Dispatch columnist Bill McClellan captured some of this feeling pretty well:

Back when the country was founded, the successful people had no reason to leave the East Coast. The less successful pushed west. This clump of unsuccessful people reached St. Louis. The adventurous ones pushed on. The slackers stayed here. Much later, we built the Gateway Arch to honor the people who had the gumption to keep going. We are the only city in the world that has a memorial to honor those who left.

So this whole thing about leaving and not leaving is in our DNA.

This underlying zeitgeist is important in understanding things in St. Louis. Nothing exists in a vacuum, and these old wounds surface at the oddest times. The guilt over not doing enough to improve the city. The guilt over leaving the city altogether. The guilt of riding someone else’s nostalgia for a building I never even entered.

So, this isn’t really about a Del Taco. Or a flying saucer. It’s about a symbol.