Does an infographic need to be “memorable” to be good? That might depend on how you define “infographic”

After reading coverage recent study about what makes charts memorable, I was convinced that there is a fundamental divide not only on what constitutes an information graphic, but also on what graphics are meant to do.

I have spent almost 10 years of my life making information graphics. I have moved to another state to take an infographics job not once, but three times. I do not consider maps, charts or diagrams to be a passing fad. Thus, I have a vested interest in how information graphics are received and perceived. I’ll see links on news sites for and “INFOGRAPHIC,” only to find that what I’ve actually clicked on is an image of icons, big numbers, some photos and flashy colors. Friends who have worked for great news agencies have shared recent freelance stories of clients choosing big numbers of multiple colors over data, charts and diagrams. Rather, in my estimation, they are rejecting actual infographics for something else, and they’re calling that “something else” an infographic.

Thus, it was with this sense of frustration that I read a bout a recent study in which people were shown multiple visualizations of data and asked which ones were most memorable. Examples with photos, logos, icons and colors were more memorable than basic charts or pie graphs. Does this serve as validation for the dressed-up web images we see billed as “infographics” on Tumblr, Pinterest and elsewhere these days?
Fortunately, no. Doctoral student Michelle Borkin of Harvard’s School of Engineering and Applied Sciences, who helped conduct the study, said “Icons, images, and human-recognizable objects will instantly make [a visualization] more memorable… But there’s this very careful caveat — and this is me speaking as a viz design person: make sure they’re helping your reader understand the main point of your data.”

I’m glad Borkin made that last point. If you remember a graphic’s presentation but you don’t remember the graphic’s content, is that really a success? I’ve seen pie charts made with actual pies, showing data from Thanksgiving studies. Or so I think. I remember the chart, but I have no memory of what it was trying to tell me.

When discussing this with colleagues at work, I said that while I do not remember all the specific articles I read on Sept. 12, 2001, I do remember the information in those articles. And I think the information and story itself is much more important than the vessel that brought you that information and story, whether the vessel was an article or an information graphic. When you’re showing a declining crime rate, what do you want the reader to ultimately remember: the trend in crime, or that you used a 75% Periwinkle 2-point stroke on the fever chart over two columns? As long as they remember that they saw the chart, and the information within, then I’m happy.

Sometimes, a graphic will require more images and colors than a simple stock chart. But I’d reiterate that decisions made in making infographics should be made because the chart requires it and it helps communicate your ultimate point. If we are adding elements just to “dress it up” or to “make it pretty,” we’re losing focus of the goal of an information graphic. Like a good news article, a good information graphic should convey information clearly in a way that does not confuse the reader. If we end up making decisions about infographics not based on the content, the graphic suffers.

There is a tendency for photos and graphics to be referred to as the page’s “art.” If the lead art falls through, the other photos and graphics on the page sometimes have to change to make up for it. On the idea of information graphics as art, Charles Blow of The New York Times once famously said: “I would like to make a distinction between information graphics and art in terms of their missions. Art need serve no purpose but to express the vision of the artist. On the other hand, the highest purpose of an information graphic is to clearly express the relationships among data. That said, if someone should call a chart art because of its beauty or message, that person would get no argument from me.”

How BostonGlobe.com’s gay marriage interactive graphic came to be

Today is the first day that Hawaii allows same-sex marriage. The state was the 16th to approve allowing gay marriage, and becomes the 15th to begin performing them. Illinois’ state legislature approved same-sex marriage a few days before Hawaii, but that law won’t go into effect until summer of 2014.

For the last four months, I have been editing and updating this BostonGlobe.com interactive graphic about the history of same-sex marriage in the United States. In short, there’s a sticky navigation that stays with you when you scroll through the timeline, show maps and tallies that change as states allow gay marriage, ban gay marriage or allow civil unions or domestic partnerships. The timeline includes links to archived stories, copies of bills and statutes, and PDFs of past Globe front pages.

The landscape as of 1996:

As of the 2004 election:

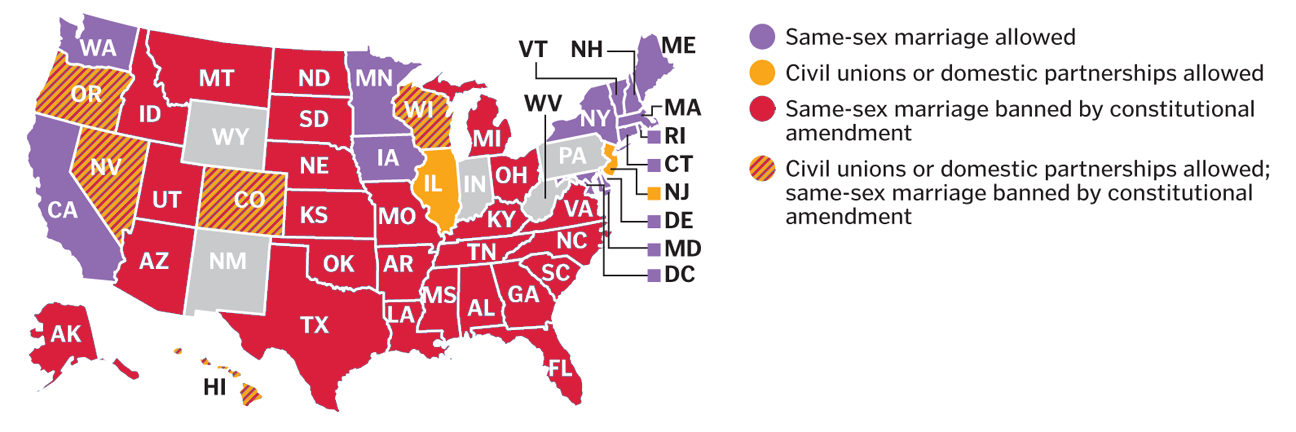
As of today, when Hawaii becomes the 15th state to allow same-sex marriage:

This sticky bar is just part of the graphic, of course, as the timeline is what triggers the changes in colors.


—————————


HOW THIS STARTED

I conceived this project right after the Supreme Court ruled on Proposition 8 and the Defense of Marriage Act. In the days that followed, we had many stories about what impact these rulings could bring. These stories usually included maps that more or less looked like this:

Those maps can be tricky to read, because they cram five different types of states into one map:
*States allowing gay marriage
*States allowing civil unions or domestic partnerships, but not gay marriage
*States banning gay marriage by constitutional amendment
*States banning gay marriage by constitutional amendment, but allowing civil unions or domestic partnerships
*The default states, not identified, which have no constitutional reference to gay marriage

These maps are helpful to glean the overall splintering of the issue, and can be used to parse out laws state by state, but are still busier than need be. I wanted was something easier to read, and after talking with Boston Globe AME for Design Dan Zedek, I decided three separate maps would work best. But even then, I thought the map alone didn’t show how much the map has changed over time.

To truly get at the heart of the story, I thought, we needed three interactive maps that changed over time.

It was late June and I set myself an August 1 deadline. I picked that date because that’s when Rhode Island and Minnesota would begin performing same-sex marriages.

So, I set to work on a variety of tasks:
*Researching gay marriage laws and milestones, both on national and state-by-state levels
*Compiling links of past stories on the milestones, both to add to the timeline and to CQ the dates I had found
*Compiling photos from those events
*Building the framework for this responsive graphic using jQuery, JavaScript and CSS
*Testing it to see where it broke
*Refining, revising, refining and more revising

As I revised this, former Boston Globe Graphics Director Javier Zarracina was very helpful in giving me advice on tweaking the design. He was also very accommodating in giving me the time to work on this project.

—————————


HOW THIS EVOLVED

I reached the August 1 deadline.

For the Metro section of the paper that day, Boston Globe Assistant Design Director for News Robert S. Davis conceived a tease graphic that could anchor the page and promote the online graphic:

Once I launched this on August 1, I would update this whenever new developments occurred. The summer and fall of 2013 saw a bunch new developments, of course, as federal agencies and state agencies began changing policies to be inclusive of married same-sex couples. I ended up having more than 100 events on the timeline. Thus, per the suggestion of Robert Davis, I divided the news stories into “key events” and “other.” The page now loads with only the key events, but the sticky nav with the maps includes a link to click that shows all the events.

This project has spawned the most unwieldy-looking Excel file I’ve ever used:

I mean, just looking at that gives me a headache.


—————————


HOW THIS TECHNICALLY WORKS

Using Shan Carter’s great resource, Mr. Data Converter, I turned that beast of an Excel file into a JSON file. The jQuery reads that and appends a main div on the page with a div for each event, including nested divs for the headline, the text, the photos, the captions and the links.

The maps are SVG, taken from a template that Chiqui Esteban created for our department. When the timeline is scrolled through, the color and tally changes are triggered by div IDs when those IDs are near the top of the screen.


—————————


HOW I FIND STORIES FOR THE TIMELINE

The obvious ones — “Illinois to approve gay marriage,” for example — present themselves. The less obvious ones come from the AP wire, Google searches and a great app that has been invaluable in this process.

Zite functions like Google News in that you can have personalized categories for your news feed. Furthermore, it lets you give a story a “thumbs up” or “thumbs down,” like Pandora.

I check Zite throughout the day, particularly on its feed for “Same-sex marriage.” It often has things that are on my radar, but it has also allowed me to find stories that I wouldn’t have known were coming.

Gay news blogs have also been invaluable. I never source a gay news blog, but I will often follow their links to news sources that I can source: The Associated Press and other newspapers. In the same vein, Twitter has also been a good way to find stories. The #gaymarriage hashtag brings up a lot of opinions, but it has helped me find stories in other states.


—————————


WHAT’S NEXT
What’s next is that I’ll keep updating this as gay marriage news continues to happen. Naturally, you’ll need to check BostonGlobe.com to see the updates.

20 years after “black album,” Metallica’s platinum records compared

It was 20 years ago this week, on Aug. 12, 1991, that Metallica’s self-titled fifth studio album was released. In the two decades since its release, the “black album” has become Metallica’s defining album. It is certified 15X platinum, far above any other studio album by the band.

Five years later, the band teamed up once again with Bob Rock, the producer of the “black album” (so named for its black cover). “Load,” Metallica’s sixth studio album, was released in the summer of 1996. Hardcore fans said that the band had “sold out.” Some said it was because the band members had cut their hair. My friend Ned felt conflicted buying “Load,” but I told him that his long hair made up for their sins of cutting their glorious manes.

Anywho, for the 20th anniversary of the album that spawned “Enter Sandman” and “Sad But True,” I thought I’d look up the band’s platinum certifications on Recording Industry Association of America’s website. Using the RIAA’s listings, I created the following chart of when the band’s nine studio albums were certified platinum, double platinum, triple platinum, and so on.

Of course, another way to compare how many times each album went platinum would be to use bars. Here is each album and its number of platinum certifications, by order of release:

What can these charts tell us?

  • The “black album” is definitely the Metallica’s biggest commercial success. Add up the number of platinum certifications for all the studio albums they’ve done since and you won’t still won’t match it.
  • The band’s platinum certifications increase with each album through the “black album” and then decrease with each album after that. Of course, all of this is with the hindsight of 20 years. The newer albums might eventually be certified platinum again after they’ve been “out long enough” to catch up with the others. I’m not sure that will happen, though.
  • In the 2000s (whatever that decade is to be called), the Metallica albums that continued to get certified had been released between 1984 and 1991.
  • The post-“black album” records see an initial jump but don’t continue getting certified the way that the other non-“black album” discs do. Again, those older albums have been out a lot longer, so they have had the time to climb steadily.

Another thought

Bob Rock produced that record and every studio album through “St. Anger” in 2003. They used a different producer for “Death Magnetic,” which a lot of die-hard fans think is the best in 20 years. My theory? Fans who gravitated toward the unpolished sounds of the first four albums liked that familiar style in “Death Magnetic.” “Metallica” had a lot more polished sound and each album sounded cleaner and cleaner. “Death Magnetic,” though, sounds like it’s going to rob you, knife you and then eat you.

Of course, maybe it’s simpler than that. Maybe it’s not Bob Rock, the band members’ hair or any of that. Many bands or artists have that classic album to which fans will compare every other album that band or artist will release. For Metallica, it’s the “black album.” Those guys could cure cancer and some headbanger would say, “That’s good and all, but it’s no ‘black album.'”

Harry Potter, Star Wars, Joseph Campbell and the hero myth

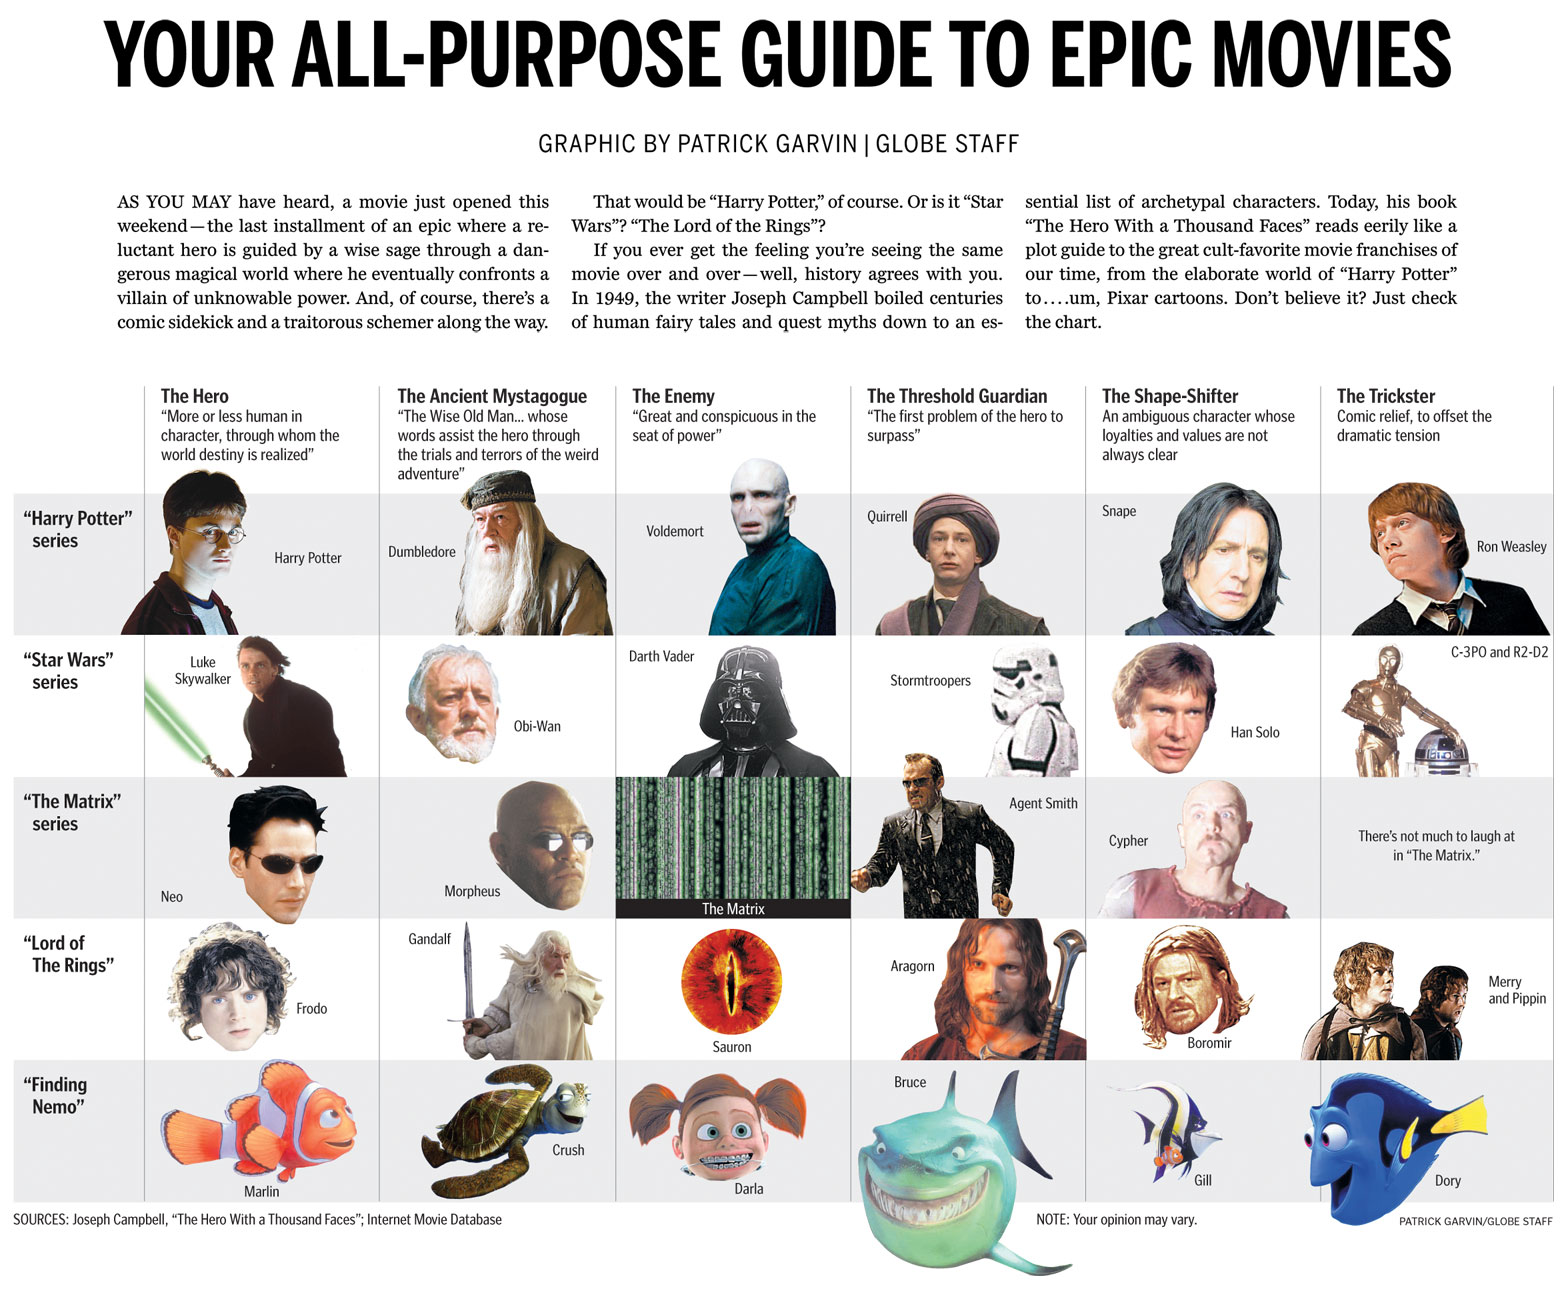
I wanted to share with you a chart from the Ideas section of this Sunday’s Boston Globe. Using the archetypes described in Joseph Campbell’s “The Hero With a Thousand Faces,” the chart compares characters from the Harry Potter series, “Star Wars,” “The Matrix,” “Lord Of The Rings” and… “Finding Nemo.”

Click for a larger view.

Boston Globe chart comparing Harry Potter, Star Wars, The Matrix, Lord of the Rings and Finding Nemo using Joseph Campbell hero archetypes

HOW IT CAME TOGETHER

I’ve long kept a graphics notebook in which I jot down and scribble ideas as they occur to me. I’m currently on the fifth notebook.

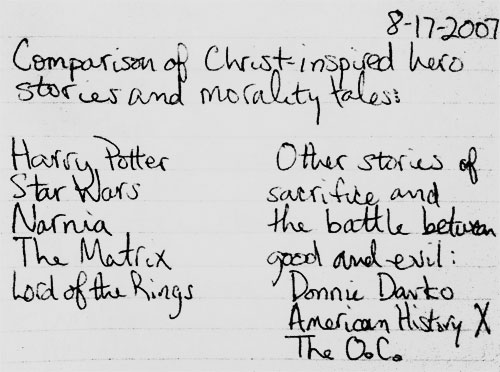
In the summer of 2007, I caught up with the world and finally began reading the Harry Potter books. I started a month or so before the final book was released. Thus, I got to start with the first book and read the entire series without pausing in between books. The day I finished the seventh book, my mind was racing with ideas. Once such idea:

I jotted whatever came to my mind, knowing I could edit it later. I had long seen the similarities in other sci-fi and fantasy movies, as I had some teachers in high school who riffed on those concepts in class. The idea sat in the notebook for almost four years. (Note to those who know me: check the date on the top of the notebook entry.)

Flash forward to this current summer, four years and one newspaper after I first read the Harry Potter books and had the idea. Colleague Ryan Huddle was working on his great Harry Potter treatment, which you can read about on Charles Apple’s blog. Dan Zedek, AME for Design, asked if I might have any ideas for “The Deathly Hallows,” as he had seen what I had done for the last Indiana Jones movie. I told him about the aforementioned notebook submission, and added that we didn’t have to focus solely on Biblical characters. We could open it up to the hero archetypes explored by Joseph Campbell, who literally wrote the book on the topic.

The next day, Dan told me he had run the idea by Steve Heuser of the Ideas section. Steve had thought the idea had potential and wanted me to rough up some notes to use as a jumping-off point. I consulted assistant graphics editor Javier Zarracina, who was a wealth of ideas. We looked up the hero myth structure, which can be very simple or complicated, depending on who’s dissecting Joseph Campbell’s books and lectures. Additionally, I am especially indebted to Mike O’Brien and Rob Bergman from DeSmet Jesuit High School in St. Louis, as they gave me tons of ideas and sites to consult.

Working with Steve and Javier, I tightened the focus to the archetypes and left out the comparisons of plot. I used Harry Potter, “Star Wars,” “Lord of the Rings” and “The Matrix,” but decided to leave off the Narnia movies. For one, I had only seen the first movie, which hadn’t had the same mass appeal as the others on the list. Steve suggested we try to find a movie that used the same archetypes but that deviated from the serious sci-fi/fantasy realm. I suggested “Finding Nemo,” and he laughed so hard that I knew we had a winner.

I originally structured the chart in a rather traditional, straightforward way. Steve suggested I use the whole width of the page, and Javier suggested I cut out some of the photos using silhouettes. Lisa Tuite and Wanda Joseph-Rollins of The Boston Globe library both helped pull photos to use. Dan helped me vary the cutouts so that they seemed more dynamic. We tweaked and tweaked, and I liked each version more than the previous versions. The graphic ended up on Boston.com by Friday afternoon.

ABOUT THE MOVIES WE DIDN’T USE

There were a ton of movies we could have used, because there are a ton of movies that use these archetypes. Besides the Narnia films, both the “Batman” series and “The Princess Bride” were suggested, as were several westerns and Akira Kurosawa films. Many non-fantasy films were suggested, too. These were all great suggestions, and I thank all of you whom I e-mailed for advice.

Ultimately, Steve, Javier, Dan and I kept the list limited to big movies and series from the past 10 years or so. We could have easily done a full-page chart with more than a dozen films and still not even scratch the surface of the films who’ve used these archetypes. The whole point of this chart is that these tropes are ubiquitous.

In addition to the films we chose (or didn’t choose), readers might take issue with the specific characters we chose for the categories. Within the newsroom, we had lots of differing opinions. Ultimately, I think this shows we came up with a great idea that will have people talking. A “talker,” if you will. Or a “Hey, Martha.”

Working on this chart appealed to several of my geek loves: “Star Wars,” philosophy, Harry Potter and infographics. Dan frequently likes to tease me for my references to “Star Wars” and “Harry Potter.” If only I could have referenced Scrabble, “The X-Files,” “Battlestar Galactica” and “Melrose Place,” the Pat Garvin interests could have all been referenced.

Next time.

INFOGRAPHIC: Rebecca Black’s “Friday” vs. The Cure’s “Friday, I’m In Love”

So, in the last few weeks, 13-year-old Rebecca Black’s song “Friday” has gone viral. It’s a song about an eighth-grader getting ready for school on a Friday and getting excited for the weekend.

Did I mention it’s by a 13-year-old?

In case you missed it:

For what it is, it’s catchy. But it’s catching lots of nasty comments for Black. Last week, she appeared on “Good Morning America” for a segment in which the reporter read some of the comments people have anonymously posted online about this video. Watch the interview, and you’ll totally feel for this kid. But for all the hate, she’s doing alright for herself. She’s passed Justin Bieber for iTunes downloads, or so say the talking heads on that ABC clip.

The last pop song about Friday I remember getting any attention was The Cure’s “Friday, I’m In Love” from the band’s 1992 album, “Wish.”

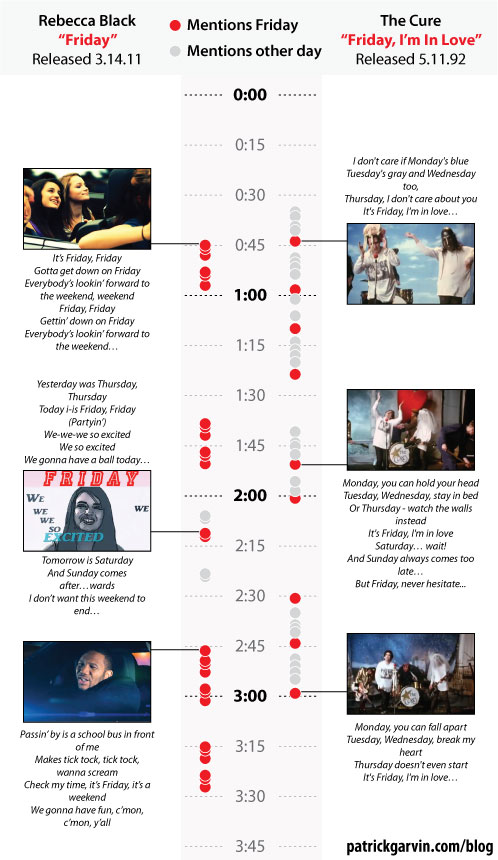
The Cure video’s embed feature has been disabled, or else I would have linked to it. But check it out, and then take a look at how each of these songs compare as odes to the last day of the work week:

So, from my estimations, here’s a breakdown of each song and its video:

Total mentions of “Friday”
Rebecca Black, “Friday”: 27
The Cure, “Friday, I’m In Love”: 9

Total mentions of any other day of the week
Rebecca Black, “Friday”: 4
The Cure, “Friday, I’m In Love”: 28

Verses sung by a rapper
Rebecca Black, “Friday”: 1
The Cure, “Friday, I’m In Love”: 0

Tween girl wearing braces
Rebecca Black, “Friday”: 1+
The Cure, “Friday, I’m In Love”: 0

Pasty white man wearing a wedding veil
Rebecca Black, “Friday”: 0
The Cure, “Friday, I’m In Love”: 2

So, Rebecca Black gets down on Friday, whereas Robert Smith gets down MOST on Friday. Of course, he also has been known to get down at “10:15 On A Saturday Night.” Rebecca Black, though, would not be getting down at that time, as she’d be in bed. Or at a sleepover, playing MASH.

Florida to Boston: The Tally

My dad flew to Jacksonville from St. Louis on Wednesday. On Thursday, we finished packing, loaded the truck and cleaned the apartment. Friday, we did the final inspection of the apartment with the landlord. And then, as they say, we were off and up out.

Friday: Jacksonville to Fayetteville, N.C.
Saturday: Fayetteville, N.C., to Norwalk, Conn.
Sunday: Norwalk, Conn., to Medford, Mass.

Dad and I had one companion throughout the trip: the GPS. She was dubbed “Pam” a few years ago by my nephew, who liked Pam from “The Office.” That character, though, was well-liked. Pam, the GPS, did not receive as glowing a review. Particularly on the George Washington Bridge. The AAA Trip-Tik underwent a redesign since the last time we used one, though, so we didn’t use that as much. But, we got here, and that’s the most important thing.

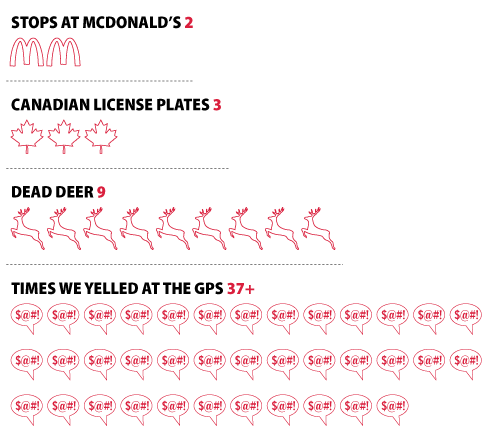
The important stats between Florida and Massachusetts are as follows:

Those dead deer were deer we saw, already dead, mind you. The truck was a peaceful truck, though energetic. Not unlike a Springer Spaniel, we decided.

Other noteworthy observations Dad and I made:

1 firetruck graveyard (Off I-95 in N.C.)
1 lot full of swimming pool inserts (Again, off I-95 in N.C.)
2 signs for the Pee Dee River (or creek or whatever, in S.C.)
1 frost on the windshield! (Saturday morning, in N.C.)
4 irreplaceable friends awaiting us at storage unit
Countless new adventures

How much federal funding does NPR receive?

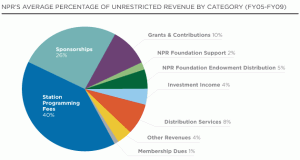
In the days since Juan Williams’ firing, people have begun calling for a “de-funding” of NPR. But how much federal money actually goes to NPR? Andrew Phelps of WBUR posted on Hubbub a chart of NPR’s funding sources:

Click for a larger view.

Phelps writes:

I said it before, but I’ll say it again: NPR receives no direct funding from the federal government for operations…

The largest share of NPR funding comes from its member stations (including WBUR).

The local stations receive some funding from the Corporation for Public Broadcasting, a taxpayer-funded, nonprofit, private corporation, created by Congress in 1967. (Think of it like the Red Cross.)

NPR does receive grants from CPB for special projects, but that funding is not included as part of the network’s operations budget.

So while federal dollars do flow to NPR, the connection is indirect. It may be a fine point, but it’s an important distinction. The federal government can’t “defund” NPR. What Congress can do is cut CPB funding — which has diminished over the years and has, at times, been threatened.

For more Hubbub, go here. For Andrew Phelps’ personal page, go here.

Comigraphic: How social media makes your birthday awesome

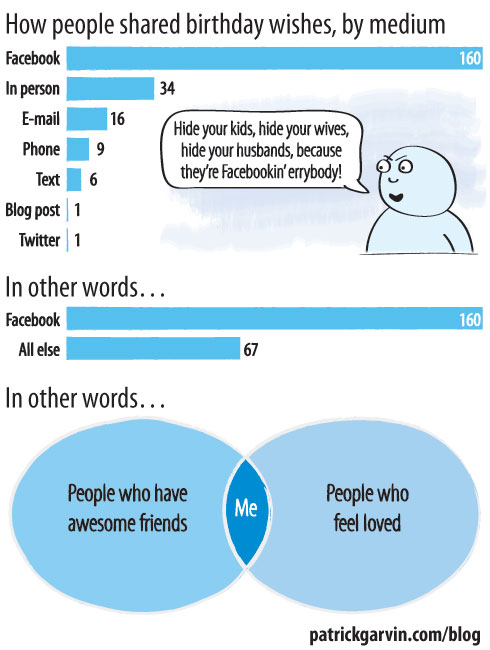
A few weeks ago, one of the newsroom interns tallied the number of people who had wished him a happy birthday, breaking it down by medium. He had gotten phone calls, Tweets and e-mails, but the largest number of well wishes came from Facebook.

With that in mind, I kept a chart on my birthday last week to see if that trend would hold true for me. It did, and probably holds true for you, too. I have some theories as to why this is: Facebook reminds you of upcoming birthdays, and tells you when your friends have written on the walls of mutual friends for their birthdays. Regardless of why, it was much appreciated.

August 8: In case you missed it…

In case you missed these graphics and interactives in the last few days:

States that allow same-sex marriage vs. States that allow marriage between first cousins [I Love Charts]

Charles Blow tweeted this yesterday. It is, as you might guess from the title, a look at the states allowing same-sex marriage compared to the states allowing marriage between first cousins.

—-

Back to the Future timelines [Sean Mort, via FlowingData]

This chart breaks down the timelines from the “Back To The Future” trilogy. Compared to this, the various “Lost” timelines were totally followable.

—-

The Brett Favre Retirement Curve [Slate]

Dubbed “an interactive visualization of the quarterback’s annual off-season waffling,” this chart is a fever chart of sorts showing his waffling between “comeback,” “not sure” and “retirement.” And, the colors match those of the teams for which he’s played.

—-

Missouri’s sexually transmitted disease rates [stltoday.com]

The topic might not be pretty, but that’s why this chart is all the more important. It allows you to search by county, zip code, year and STD. My home county, St. Louis, has consistently ranked among the nation’s worst for at least two of the diseases, chlamydia and gonorrhea. This was put together by Brian Williamson, who consistently does great graphics databases. See this, like, now.

—-

Got some stuff we missed? Send ’em our way.