How to make your own Mr. Map Generator with your own SVG

A few days ago, I wrote about a responsive mapping tool I created called Mr. Map Generator and explained how to use it. Charles Apple blogged about the reasons behind why I created the tool. In the days since, people have reached out to ask me how they could make similar generators for their own cities, states, countries, and so forth.

The aim of this post is to walk you through the process of how to do that, starting with an Illustrator AI file and ending with testing it to make sure it works. It might seem like a tedious process, but it will be worth it in the end when you can easily generate maps rather quickly.

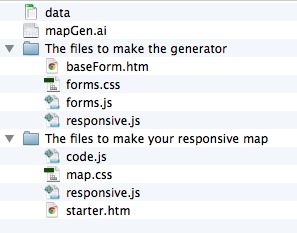
Here is a zip file that includes all you’ll need:

  • An Excel file for your data
  • An Illustrator file I’ve created for this exercise
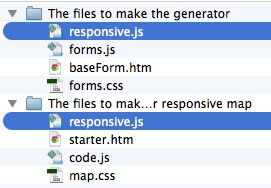
  • A folder called “The files to make the generator”
  • A folder called “The files to make your responsive map”

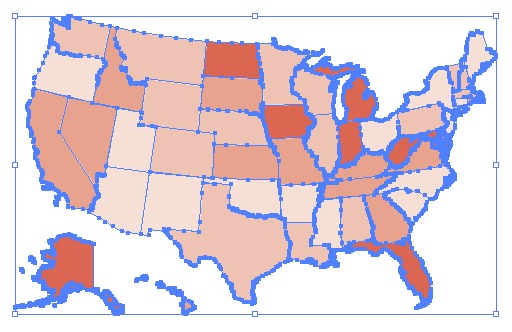
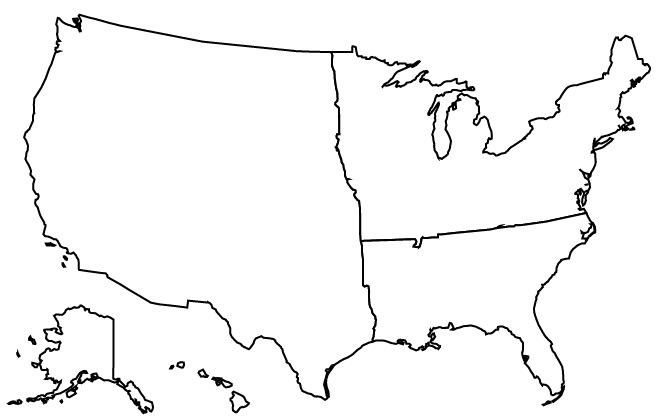
Open up the Illustrator file called mapGen.ai. In this example, I’ve put together a map that divides the US into three regions: the west, the southeast and the northeast. This was an arbitrary selection of just grabbing states and making a path with the pathfinder tool. Meaning that… No, I don’t think the northeast extends down to the midwest. It’s simply relative to the other shapes, as it is the most northern and eastern of those shapes.

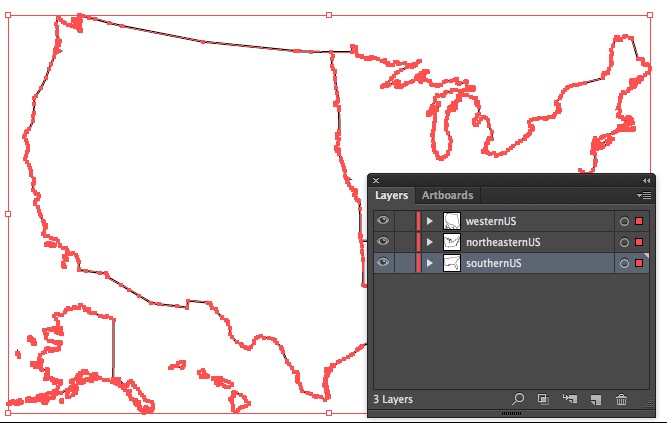
Each section of the map has its own layer in the Illustrator file. Furthermore, each layer has a name describing the content of said layer: southernUS, northeasternUS, westernUS. These names are one word, with no spaces or breaks. This is important.

To be safe, I select everything in the layer and then use the pathfinder tool to combine those elements to make a compound path. You can also go to the objects menu, select compound path and then select make.

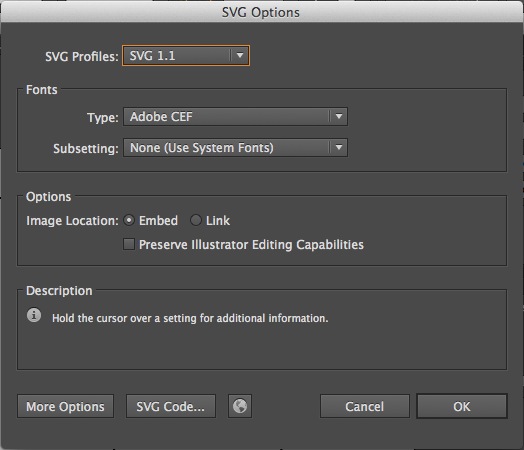
Save the Illustrator file as an SVG. It’s easy to do in the “Save as” settings.

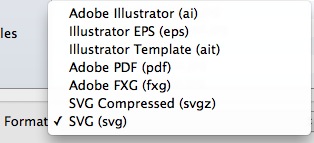
Illustrator will give a pop-up and you can leave it be.

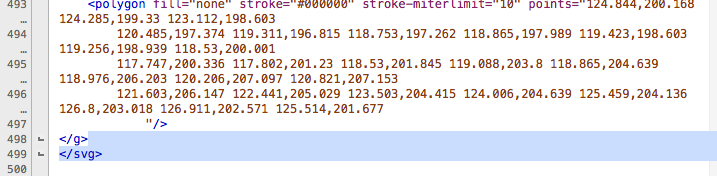
Once you’ve saved the file as an SVG in Illustrator, open it in a text editor. Programs like Notepad or TextEdit are free with your computer. They are perfectly functional, but I use TextWrangler, which you can download for free. It color-codes tags in HTML and makes it easier to organize what you’re writing.

When you open the file in a text editor, it could look rather daunting if you’ve never looked at SVGs in text editors. Looks like a lot of gibberish, right?

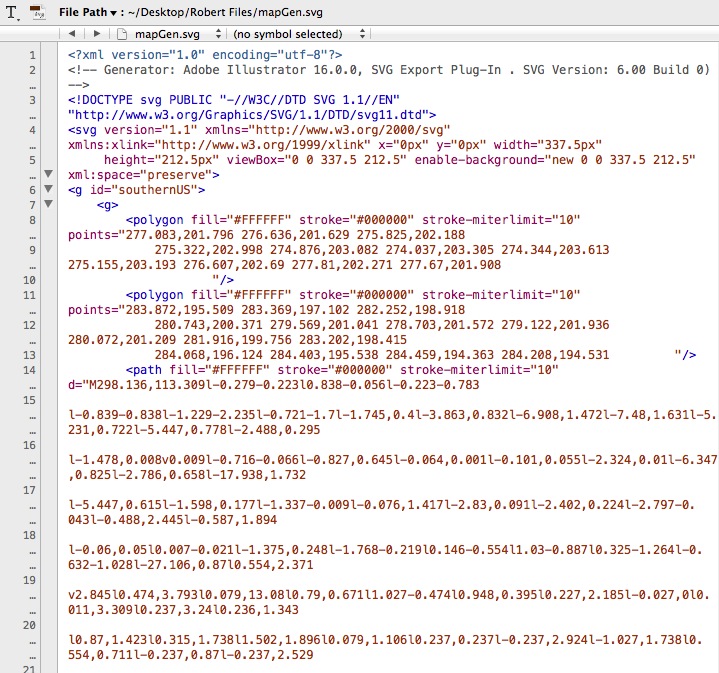
And yet while it looks foreign at first, certain things will look familiar. Just as p tags and div tags need opening tags and closing tags, so do g tags. For the sake of this exercise, let’s think of g tags as like div tags for SVGs.

Look on one of the earlier lines in the code, probably around line 6.

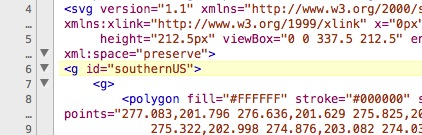
You see that, right? Of course you do: one of the g tags has an ID of “southernUS.” It has that ID because that’s the name of one of the layers from the Illustrator file. Whatever those layers are called will be the same names used as the IDs for the corresponding g tags. That’s why it’s important to name them something easier to distinguish from each other than just using “Layer 1,” “Layer 2” and “Layer 3.”

Look just above that line to line 5, particularly the part that says “viewBox.”

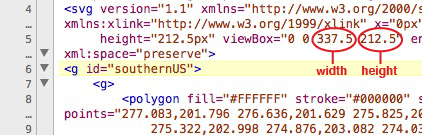
Look at the part that says viewbox=”0 0 337.5 212.5.” That 337.5 means the box for your SVG is 337.5 pixels wide and 212.5 means it is 212.5 pixels tall. We’re going to eventually delete that part, but before we do, write down those two numbers somewhere or copy them into another file.

Write them down yet? Ya sure? OK, good.

In your text editor, highlight everything from the first line until the space just before the first g tag.

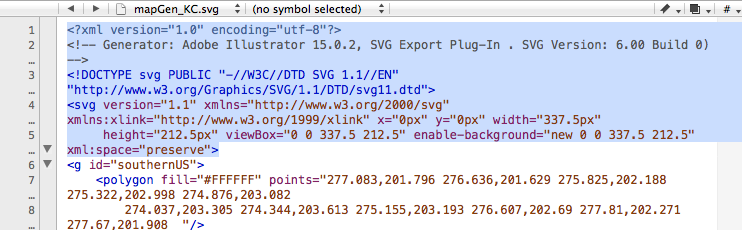
Got it highlighted? Good. Now delete that.

At the bottom of the document, highlight everything after the last closing g tag. And then hit delete.

Now we just have to clean up the file a bit.

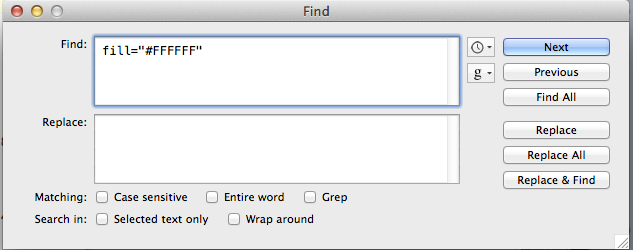
In my original file, the shapes had a black stroke and a white fill. We want to get rid of that. Do a find-and-replace search for fill=”#FFFFFF” and replace it with nothing.

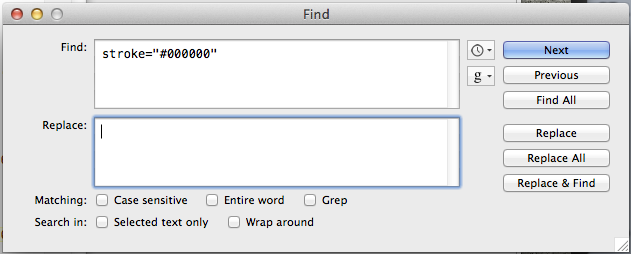
Next, do a find-and-replace search for stroke=”#000000″ and replace it with nothing

The last find-and-replace search is to find all the g tags that include an id. Our file will have three.

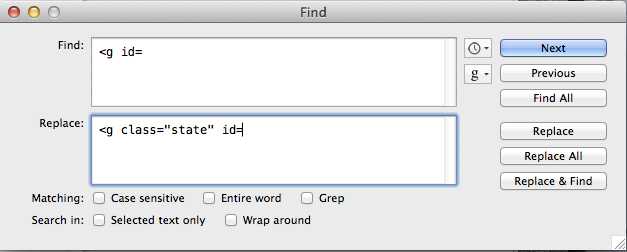
By adding class=”state,” we are assigning a class to our three g tags. That class is defined in the CSS files already downloaded.

Now select all that’s in the document and copy it. We’re ready to add it to our two different HTML files.

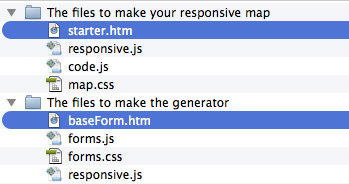
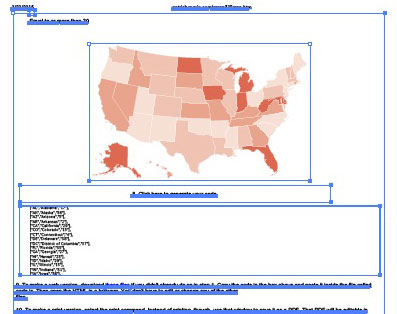
We have two files: baseForm.htm and starter.htm. The first one, baseForm, is the template for the page where you actually paste your data, click the buttons, decide your colors, preview your map, etc.

The other file, starter.htm, is the blank file that will become your map that you post.

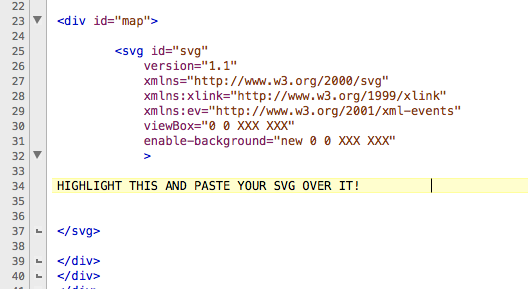
In both files, look for the part that says, “HIGHLIGHT THIS AND PASTE YOUR SVG OVER IT!” Highlight that part, and well, do what it says: Delete it, and paste your SVG that you’ve cut and pasted.

In starter.htm, that is going to be on line 34.

In baseForm.htm, that is going to be on line 89.

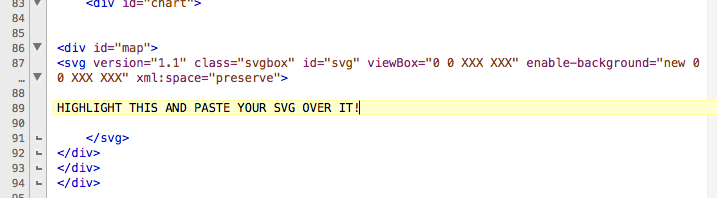
While you’re in those files, notice the parts that say “viewBox” and “enable-background.” Particularly, notice that they each include a line that says “0 0 XXX XXX.”

This is why I told you to write your width and height down. Or paste it somewhere. Because now you need it.

Paste over “XXX XXX” with your actual width and height. So if your SVG had a width of 300 and a height of 400, “0 0 XXX XXX” should become “0 0 300 400.” In our case with our files, we had a width of 337.5 and a height of 212.5, so we changed “0 0 XXX XXX” to “0 0 337.5 212.5” in our files.

Save the two HTML files, close them, and go back to the two folders. In both folders, there will be a JS file called responsive.js. Open both of those.

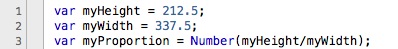
The top three lines of each one will look like this:

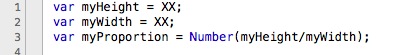
In both files called responsive.js, change the XX to reflect the appropriate value. Our exercise, with our three regions of the US, had a width of 337.5 and a height of 212.5.

Save the JS files and close them. The only thing left now is to format your spreadsheet.

In the zip file you downloaded, open the Excel spreadsheet called data. It should be blank and look like this:

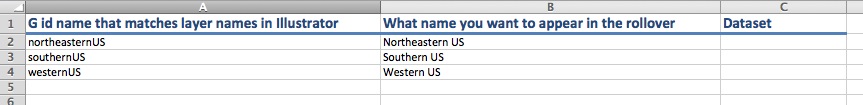
We have three columns: “G id name that matches layer names in Illustrator,” “What name you want to appear in the rollover,” and “Dataset.”

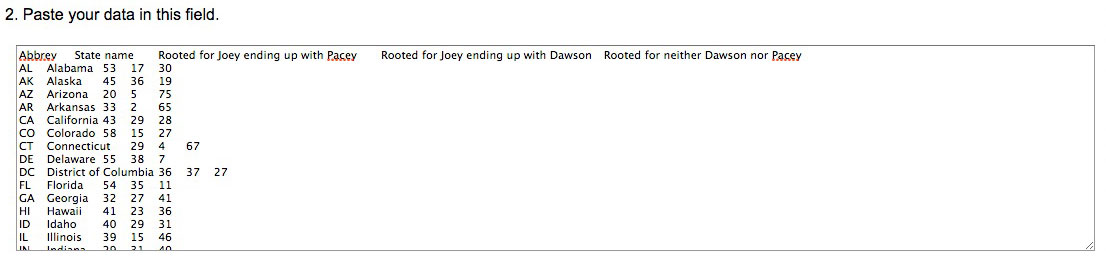
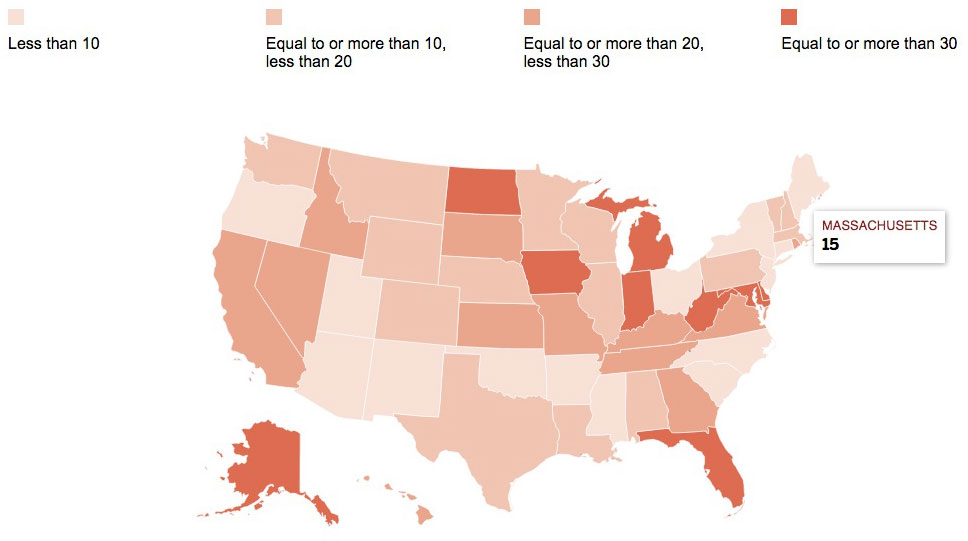
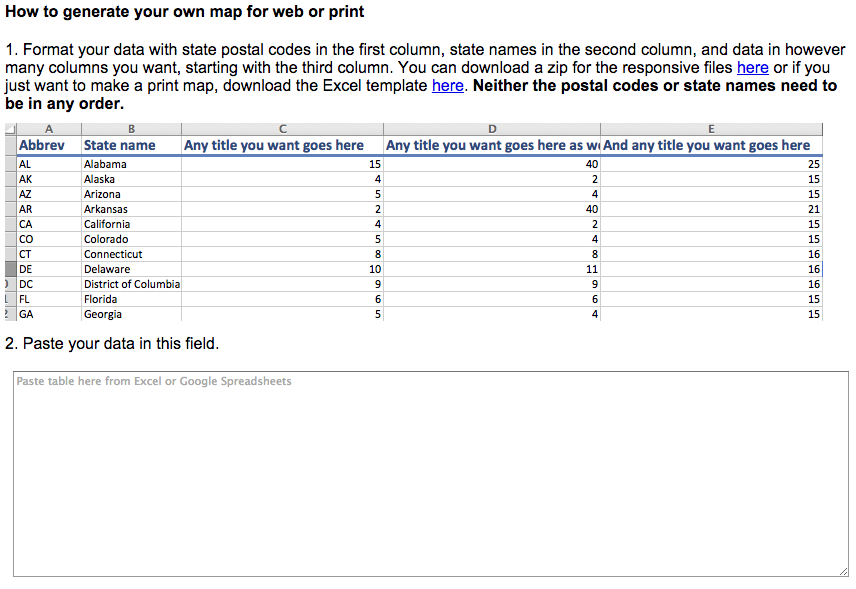
We’ll use an example from the previous blog post about how to use Mr. Map Generator. Here is a screen grab we had of state-by-state data about the “Dawson’s Creek” finale, showing the percentage of people in each state who rooted for Joey to end up with Pacey, Dawson, or neither.

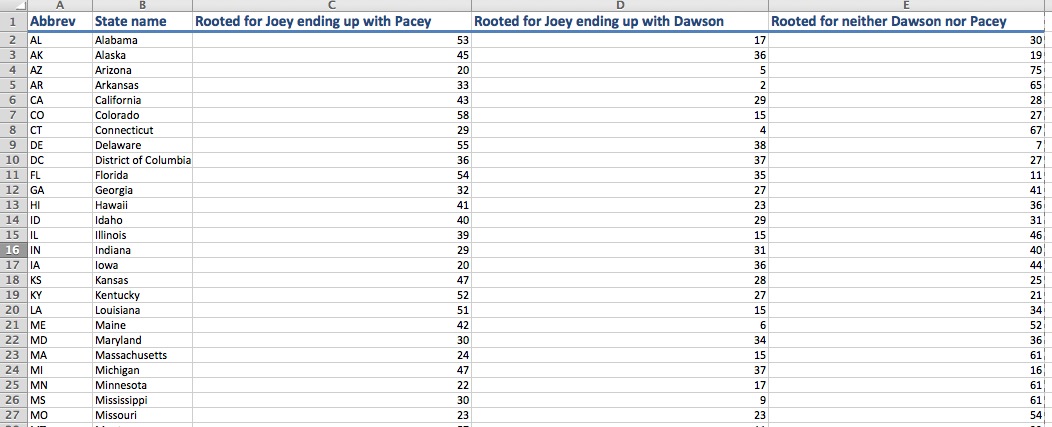
Notice that the first column is the US postal codes, the second is the name of those states, and columns three through five are actual numbers.

The postal codes match the names of the g tags in the SVG. So, the row with MA in the first column corresponds to Massachusetts, and the g in the SVG has an id of MA. For this to work, the text in the first column has to match the g tags in the SVG files.

In our Illustrator file, we gave the layers these names: southernUS, northeasternUS, westernUS. Thus, our g tags have the ids of southernUS, northeasternUS, and westernUS. Thus, we have to use those in our first column in our Excel spreadsheet.

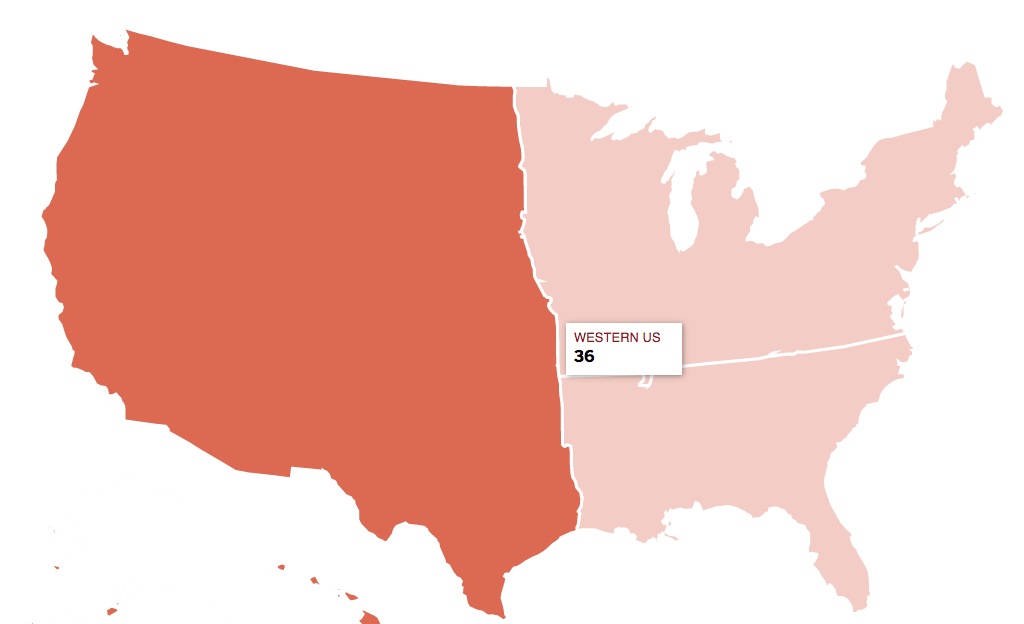
The second column is where we type whatever we want to see when the user rolls over the shape. That can be whatever you want.

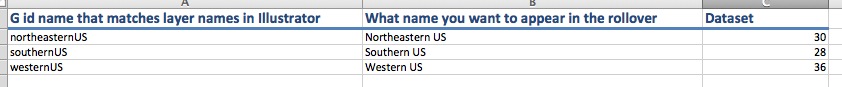
And the third, fourth, fifth, sixth, seventh, and forever onward columns can be, well, the actual data.

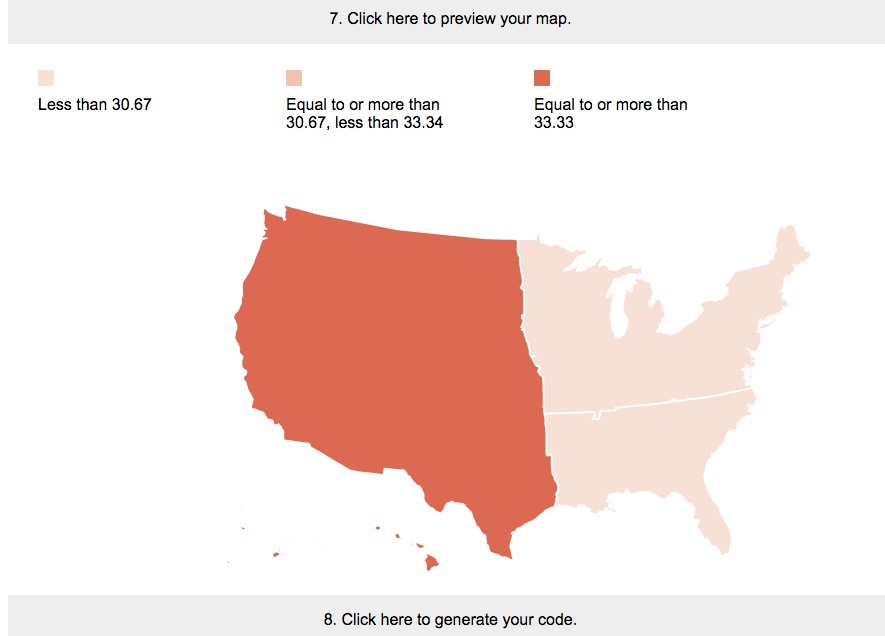
So now you’re ready to test out your generator!

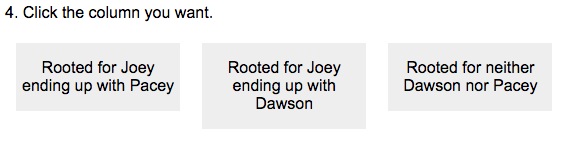
Copy your data from your spreadsheet, and in baseForm.htm, paste it to try it out.

If it doesn’t work at first, refresh it once or twice. If it still doesn’t work, check console.log to see if any errors appear.

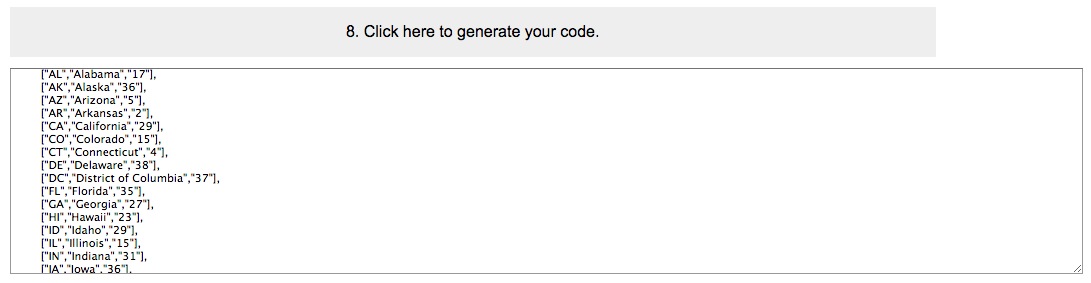
If it does work, copy the code from step 8 and then paste it in code.js.

It might seem like a tedious process, but it will be worth it in the end when you can easily generate maps rather quickly.

How to use Mr. Map Generator, a map tool for journalists

In a recent blog post about journalists using technology to make their lives and jobs easier, I mentioned that I created templates in Illustrator of the maps we use the most. I saved those as SVGs and then turned those SVGs into HTML. The heavy lifting was writing code for a map generator that would allow me to copy and paste spreadsheet data to color-code the maps for me. It took some time, but it paid off. It creates responsive maps that I can easily pluck onto the website, but I can also print-to-PDF those suckers and have the basis for the print version. People who have made vector maps will know that the “old way” of having to select each state/county individually to color-code it was a pain. And fraught with the possibility of introducing error.

Mr. Map Generator has maps of the US, Massachusetts and Boston. For this post, I’ll explain how to use the US map generator, though the concepts will be almost the same for the other map generators.

GETTING STARTED

1. We’ll start with a spreadsheet. I usually use a Google Spreadsheet or an Excel Spreadsheet. In our fake spreadsheet, we will pretend it’s a spreadsheet about the “Dawson’s Creek” finale, showing the percentage of people in each state who rooted for Joey to end up with Pacey, Dawson, or neither. Obviously, these are made-up numbers, because most people will agree that Joey should have ended up with Pacey. But for the sake of this exercise, we will pretend.

Format your data with state postal codes in the first column, state names in the second column, and data in however many columns you want, starting with the third column. You can download a zip for the responsive files here or if you just want to make a print map, download the Excel template here. Neither the postal codes or state names need to be in any order.

2. On the page of the US map generator, paste your data in the field that says, “Paste your data in this field.”

3. After pasting your data, click on the button that says, “Click here to select your data set.”

4. After you’ve done that, you’ll get a button that shows you the columns from your spreadsheet. In this scenario, as we’ve created a fake spreadsheet, our options are “Rooted for Joey ending up with Pacey,” “Rooted for Joey ending up with Dawson,” and “Rooted for neither Dawson nor Pacey.” For the sake of this exercise, I’ve clicked on those who “Rooted for Joey ending up with Dawson.” Which, of course, was not how it ended.

5. Step 5 allows you to select your color from the options of red, blue, a gold/yellow, green, and purple. Step 6 allows you to decide whether you want the map to have 2, 3, 4 or 5 colors, or to be a chloropleth where the smallest value is the lightest shade and the largest value gets the darkest shade.

6. In our case, we’ve opted to have four shades of red. The generator is designed to calculate your smallest value and your largest value, and then calculate the ranges in between those two values. I strongly suggest not leaving those values as is, for a variety of reasons:

  • Outliers that skew the ranges
  • Ranges that aren’t intuitive (6.1-11.6, 11.6-17.1, etc.)

7. Once you have selected your color and ranges, you can click a button to preview your map. Do that.

Here’s what your map will look like:

8. You’ll then have the option to generate your code. It will appear in a text box.

9. To make a web version, download these files if you didn’t already do so in the first step. Copy the code in the box above and paste it inside the file called code.js. Then open the HTML in a browser. You don’t have to edit or change any of the other files. When you upload it to your server space, you’ll need four files:

  • code.js
  • map.css
  • US-map.htm
  • US-responsive.js

10. You’ll need to add a key/legend on your own. If you inspect element on this page, you can copy the HTML you’ll need and can plunk it into US-map.htm before uploading it.

11. To use this to make a vector print map, right click and select “Print.”

12. In the print dialog box, select “Save as PDF.” I usually have it only save page 2 of the PDF, rather than saving the entire file.

13. I then open that PDF in Illustrator. Using the white arrow, I select everything I want to delete. I delete until all is left is the shapes of the states.

14. Once I’ve deleted the extra parts from the PDF, such as text characters, I have only the map left. I then plug that into a Globe template file. I’ve done enough of these that I have a starter file with the state labels in place.

If you see yourself making a lot of these, having an Illustrator template with a layer of labels is not a bad idea.

<b>RELATED:</b> How to make your own Mr. Map Generator with your own SVG

“Should journalists learn code?” Well, what exactly do you mean by “code”?

There have been many blog posts and articles that pose what has become a divisive question: Should journalists learn code?

There’s a lot of passion in the comment sections on these posts, but I’ve wondered if we’re all on the same page as to what the question means.

“Should journalists learn code?”

What do we mean by “code”? Do we mean HTML and CSS, which are markup languages? Or do we mean languages such as JavaScript and jQuery? Or do we mean Ruby? Python? C++? Journalists who don’t know what they don’t know might be tempted to lump everything together, but they’re not all the same.

What do we mean by “learn”? Do we mean learn everything until we are masters? Do we mean learn enough to be proficient? Do we mean that we should learn some of the basic concepts so we can follow conversations with our colleagues about projects?

Does this mean everyone should learn the same skills? Should reporters, editors, developers, photographers and graphic artists all learn the same programs and languages? Should they all be proficient at an expert level?

“Should journalists learn code?” will mean different things to different journalists, and the anxiety that question brings with it also brings valid concerns. Many journalists equate that question with completely changing their job. Some could think of it in terms of web galleries and managing assets on a web site. Some have told me they think of code as high-level computer programming and thus think of it as losing any aspect of reporting or editing in their jobs to instead solely write code. Others have not-unfounded worries that some newsrooms could farm out more work to fewer people. In other words, they muse, if journalists have to take on more work, and even different kinds of work, how can they do any of it effectively?

These are the concerns of many journalists, and thus we have been asking the wrong question all this time. There’s a better question to ask than “Should journalists learn code?”

The better question to ask is, “How can journalists use technology to be better at their jobs and to make their jobs easier?” A follow-up question can be, “How can markup and/or coding languages help journalists be better at their jobs and to make their jobs easier?”

These two questions are intentionally open-ended, and hopefully have a much more positive spin to them. It doesn’t imply changing your job or having to learn MIT-level technology. “Technology” doesn’t have to necessarily mean “code.” Any journalist who’s used Excel or Google Refine has used technology to make his or her job easier.

This question does not have any one right, binary answer, because each journalist will need different technologies for different reasons based on what his or her job is. As a person who makes interactive graphics, it behooves me to stay on top of the best practices for jQuery and JavaScript. But I don’t expect our metro columnists to feel the same need to master jQuery and JavaScript. They might scrape data, clean up spreadsheets or use coding languages with their reporting, because that can make their job easier.

“Should journalists learn code?” makes people defensive. They get their guards up and lose track of the ways they can mine data and use it to make their projects richer.

Here are examples of how I’ve integrated technology into my workflow to make things easier for me:

*When making bar charts in Illustrator, I never manually type the data values for the bars. I copy the chart, and modify that copy so that the text of the values appear. I ungroup that chart and voila, I have labels without me having to risk typing a typo.

*We tend to make a lot of color-coded maps, so I created templates in Illustrator of the maps we use the most: US, Massachusetts towns, Boston neighborhoods, etc. I saved those as SVGs and then turned those SVGs into HTML. That was just a few clicks and typing of lines. The heavy lifting was writing code for a map generator that would allow me to copy and paste spreadsheet data to color-code the maps for me. It took some time, but it paid off. It creates responsive maps that I can easily pluck onto the website, but I can also print-to-PDF those suckers and have the basis for the print version. People who have made vector maps will know that the “old way” of having to select each state/county individually to color-code it was a pain the ass. And fraught with the possibility of introducing error.

*When working on web projects, I almost always use spreadsheets. Lately I’ve used Google spreadsheets so that reporters and editors can make changes. I then use Mr. Data Converter to turn that spreadsheet into a JSON and then write the JavaScript/jQuery that will cycle through that data and write out HTML for me. I do that rather than having to copy and paste things, because it’s ultimately easier and because copying and pasting things into divs leaves the possibility of pasting in the wrong place.

You might sense a theme in those three examples: All three of them are processes I’ve adopted so as to minimize or eliminate errors. Cutting down on errors is good for us, our bosses, our readers and our sources. It’s good for everyone. Using technology to help me do that was worth any of the effort I put into it. It also taught me skills that allowed me to help colleagues in ways I hadn’t been able before.

The web is to our culture now what water is to a fish. If we ignore the basics of how the web works, we do so at our own peril. The more tools we have in our toolbox, the more our projects will benefit. A reporter who pores over public records could do well to understand how to scrape data from web sites. That same reporter could benefit from knowing how to clean up data, either through Excel or Google Refine.

Given the choice between two equally talented writers, I would bet news organizations want people who can do more with the web, not less with it. It’s going to be hard to find a journalism job posting that doesn’t want someone who has at least a basic understanding of general web concepts. No, that does not mean that reporters will need mastery understanding of HTML, CSS and JavaScript to get a job. But if the reporter is going to be working with designers and developers who will take that reporter’s story and turn it into a web presentation, shouldn’t the reporter at least have a broad understanding of what those people do? The reporter doesn’t need to know how to do those other jobs, but should at least know some of the challenges, including that the way a web page looks on a desktop is not necessarily how it looks on a mobile phone.

Reporters are good at researching the processes and terminologies of the organizations they cover, whether it’s a basketball team or a school board. A good tech reporter doesn’t have to be able to build the technology he’s covering, but he at least should be able to know enough to follow along when talking to sources and then be able to explain the important parts to readers. We should have that same mindset in our newsrooms. A reporter and a developer working on a big web project together will have different roles on that project, but they should at least communicate what they need from each other and how they can help each other most effectively.

This week in LGBTQ news, April 7-13

In case you missed it, here are some of the biggest news pertaining to LGBTQ issues to come out of the last week:

ACLU filed suit in North Carolina
The American Civil Liberties Union launched a new legal assault on North Carolina’s constitutional ban on recognizing same-sex marriage, urging a federal judge to quickly negate it to help children and gay couples suffering from urgent health problems. The civil rights group said it was seeking to speed up a decision in lawsuit filed in 2012 by citing the urgent health needs of a child who suffers from cerebral palsy who was adopted by one of the lesbian couples involved in the case. The ACLU also filed a new lawsuit on behalf of three other lesbian couples struggling with health conditions made more difficult because they lack legal recognition of their marriages performed in other states, said ACLU staff attorney Elizabeth Gill.

For more context:
ACLU sues for faster action to overturn North Carolina same-sex marriage ban [Charlotte Observer]
‘We don’t have time to wait,’ 78-year-old gay plaintiff says [News & Record]

—————

Federal judge ordered Indiana to recognize couple’s marriage
A federal judge ordered Indiana to recognize the out-of-state marriage of a gay couple before one of the women, who has ovarian cancer, dies. The decision, specific to the couple, who married in Massachusetts in 2013, doesn’t affect other lawsuits challenging Indiana’s ban on same-sex marriages.

For more context:
Indiana must recognize couple’s marriage [The Boston Globe]
Judge grants request to force Indiana to recognize couple’s same-sex marriage [The Indianapolis Star]
Judge orders Indiana to recognize ailing gay woman’s marriage [The Chicago Tribune]

—————

Tom of Finland stamps announced, Harvey Milk stamp ceremony at White House announced
Itella Posti Oy, the Finnish equivalent of the United States Postal Service, announced it will release new stamps featuring the sketches of Touko Laaksonen, better known as Tom of Finland. Per the announcement:

His emphatically masculine homoerotic drawings have attained iconic status in their genre and had an influence on, for instance, pop culture and fashion. In his works, Tom of Finland utilized the self-irony and humor typical of subcultures.

During his career, Tom of Finland produced more than 3,500 drawings. The two drawings on the stamp sheet were selected by graphic artist Timo Berry, who designed the stamp, and Susanna Luoto, the Finnish representative of the foundation named after Tom of Finland operating in Los Angeles.

The stamps will debut in the fall. Unless you’re my mother or my nephew, click here to see the stamps. But if you are my mother or nephew, then please, do not click there.

—————

Chelsea Manning to serve as honorary grand marshal of San Francisco Pride Parade
Chelsea Manning, an imprisoned U.S. Army private charged in a massive leak of U.S. secrets to the WikiLeaks website, will serve as an honorary grand marshal in this year’s San Francisco Pride parade. Parade organizer Gary Virginia said Friday that Chelsea Manning — formerly known as Bradley Manning — was chosen to make amends for a controversy last year. Manning was named an honorary grand marshal ahead of the 2013 parade, but had the honor revoked. Virginia apologized, saying that decision was mishandled.

For more context:
Bradley Manning won’t get Pride honors [San Francisco Chronicle]
San Francisco gay pride rescinds honour for Bradley Manning [The Guardian]
Chelsea Manning parade retraction still creating tension on SF Pride board [San Francisco Examiner]

—————

Open letter to Pope Francis urges him to change church teaching on homosexuality
The head of a homeless shelter for LGBT youth published an open letter to Pope Francis in The New York Times Sunday, asking him to change the Catholic Church’s teaching on homosexuality.

I write to you as a Roman Catholic, a former Benedictine monk and as a gay man who has spent over 30 years serving the homeless, first as a member of the Catholic Worker Movement, and now as the founder and Executive Director of the Ali Forney Center, America’s largest center for homeless lesbian, gay, bisexual and transgender (LGBT) youth based in New York City.

I write on behalf of the homeless LGBT youths I serve. I ask you to take urgent action to protect them from the devastating consequences of religious rejection, which is the most common reason LGBT youths are driven from their homes. At the heart of the problem is that the church still teaches that homosexual conduct is a sin, and that being gay is disordered. I hope that if you understand how this teaching tears families apart and brings suffering to innocent youths, you will end this teaching and prevent your bishops from fighting against the acceptance of LGBT people as equal members of society.

Read the full ad here.

—————

Alan Simpson announces support for same-sex marriage
Former US Senator Alan Simpson has filmed a same-sex marriage commercial that will air in Wyoming and other western states. Simpson says as a Republican he believes one of the party’s core values is the right to be left alone. He says whether people are gay or lesbian or straight, if they love someone and they want to marry, they should marry.

Obama’s stance on gay marriage in 2008, and what that means in 2014

This past Friday, Mike Huckabee referenced Obama’s 2008 views on gay marriage when speaking to Laura Ingraham on “The O’Reilly Factor”:

The position that I hold is the position that Barack Obama, Hillary Clinton and Joe Biden held in 2008. Barack Obama held it until 2012. And my question that I would love to pose to the president is this: Mr. President, please explain that when you said in 2008 at the Saddleback Church forum that you stood for traditional marriage and you did so because you were a Christian and because it’s what the Bible taught, please answer: Were you lying then, are you lying now, or did the Bible get rewritten?

View the video below:

Huckabee’s not the only one referencing Obama’s stance in 2008. In the last few weeks, in the wake of Brendan Eich’s resignation as CEO of Mozilla, several pundits and bloggers have referenced Barack Obama’s views on same-sex marriage in 2008 when he was a candidate running for president. The unifying question was this: If Brendan Eich had to resign as CEO of Mozilla because he gave $1,000 to support Proposition 8 in 2008, why does Barack Obama get a pass for saying in 2008 that marriage should be between a man and a woman?

It echoes a similar question posed by Larry Elder of WND a few years ago, who asked why Rick Santorum was being scrutinized for his views on same-sex marriage, but Obama was getting a “pass” when, in Elder’s estimation, Obama had similar views as Santorum had.

DID Obama share the same viewpoint as Santorum, Eich or Huckabee? Well, how comparable Obama is to Eich, Huckabee or Santorum depends on how narrowly or broadly you define his views in 2008.

Indeed, in 2008, at Saddleback Church, Obama did say, “I believe that marriage is the union between a man and a woman. Now, for me as a Christian… it is also a sacred union. God’s in the mix.”

Click the YouTube video below to watch in full.

In that video, after saying that he believed that marriage is between a man and a woman, then-candidate Obama said he supports civil unions. He also said he does not believe in a constitutional amendment defining marriage. As recently as 2012, a month after Elder’s column comparing Obama to Santorum, Santorum voiced opposition to civil unions for same-sex couples while saying that he couples could work through the existing legal system to use contracts to get each of the rights associated with marriage.

Thus, to compare someone’s views on same-sex marriage to Barack Obama’s view in 2008 simply on the definition of marriage as a man and woman doesn’t tell the whole story on Obama or that other person’s viewpoints on civil unions. To only stop at the man-woman definition of marriage is too narrow and potentially misrepresents both Obama and the people to whom he’s being compared.

Specifically, if we’re comparing Obama and Brendan Eich. Eich was pressured to resign because he gave $1,000 to support Proposition 8. Obama, in 2008, did say, “I believe that marriage is the union between a man and a woman.” But in 2008, Obama also said that Proposition 8 was “divisive and discriminatory.”

It’s unknown why Eich supported Prop 8, or what his personal views are. When the donation became public knowledge, he said he didn’t want to discuss Prop 8 on his blog or on Twitter. He said he wanted to focus on the company, not his personal beliefs.

[W]ithout getting into my personal beliefs, which I separate from my Mozilla work — when people learned of the donation, they felt pain. I saw that in friends’ eyes, [friends] who are LGBT [lesbian, gay, bisexual, or transgendered]. I saw that in 2012. I am sorry for causing that pain.

Hampton Catlin, a developer who couldn’t legally marry or start a business with his partner until the Supreme Court ruled last year that backers of Proposition 8 lacked standing, had blogged that he and his husband Michael would be pulling their product from the Mozilla Marketplace. Many came to see them as the figureheads of the boycott. After Eich’s resignation, Hampton Catlin wrote:

I met with Brendan and asked him to just apologize for the discrimination under the law that we faced. He can still keep his personal beliefs, but I wanted him to recognize that we faced real issues with immigration and say that he never intended to cause people problems.

It’s heartbreaking to us that he was unwilling to say even that.

We absolutely don’t believe that everyone who voted yes on Prop 8 is evil. In fact, we’re sure that most of them just didn’t understand the impact the law would have. That’s why so many people have changed their mind in 4 short years – because they saw the impact and pain that the law caused to friends and family members.

People think we were upset about his past vote. Instead we were more upset with his current and continued unwillingness to discuss the issue with empathy. Seriously, we assumed that he would reconsider his thoughts on the impact of the law (not his personal beliefs), issue an apology, and then he’d go on to be a great CEO.

The fact it ever went this far is really disturbing to us.

Many think that Eich got a raw deal and it was unfair that he was pressured to resigned. But has Obama gotten a clean pass on his statements?

If Obama or anyone who voiced opposition to same-sex marriage ever got a “pass,” it certainly wasn’t an across-the-board pass from the LGBTQ community. A quick Google search of the terms “Obama” “gay marriage” shows quickly that prominent sites and blogs about LGBTQ issues — The Advocate, The Bilerico Project, GoodAsYou and Towleroad — show that Obama, Hillary Clinton and other Democrats did not get a “pass” on their stances on same-sex marriage or other issues. Bill Clinton, the president who signed the Defense of Marriage Act into law, didn’t receive a pass last year when he wrote an op-ed denouncing the law.

When former Florida governor Charlie Crist announced his support for same-sex marriage in an interview this past winter, he, too, compared his previous stance to that of Obama in 2008, but when comparing himself to Obama, he didn’t simply stop at the man-woman definition of marriage:

The President and I had the same view: we supported civil unions. I saw the interview he did with Robin Roberts last spring [in which he expressed support for same sex marriage]. I’m sure you’ve seen it. It’s powerful, because you can tell he’s speaking from the heart.

I can’t speak for the President, but I suspect that to some degree, like me, he felt his support for civil unions was political. And so he’s finally saying, ‘Enough is enough. I’m over this. I’m not going to play the political angle anymore. I’m tired of it.’ Which is just the way I feel. You get to a point in your life where you say, ‘I’m just going to tell it.’ And here I am… I’m telling it. And I don’t care what anyone thinks.

Similarly, Richard Socarides, a former adviser to Bill Clinton, conceded in a New Yorker piece last year that Bill Clinton’s signing of the Defense of Marriage Act was fueled by politics rather than personal views.

As the tide turns and public opinion changes, more and more famous politicians who opposed same-sex marriage will announce a public change in their stance on the issue. They might use the word “evolved,” like Obama did, or they will cite a family member is the reason for their change of heart, like Republican Rob Portman did in March 2013.

And as they voice their support for same-sex marriage, will their previous stances be compared to those of Barack Obama in 2008?

This week in LGBTQ news, March 31-April 6

The Brendan Eich news was by the far the most-covered piece of LGBTQ news this past week, so to mention anything else before delving into that feels like saying, “Other than that, how was the play, Mrs. Lincoln?” So, here’s what happened:

Brendan Eich, Mozilla and OkCupid
Ten days after being appointed CEO of Mozilla, Brendan Eich resigned. On Monday, a week after Eich’s appointment, dating site OkCupid greeted Firefox users with a message asking that they switch browsers before visiting the site. In an interview published Tuesday on CNet, Brendan Eich said:

[W]ithout getting into my personal beliefs, which I separate from my Mozilla work — when people learned of the donation, they felt pain. I saw that in friends’ eyes, [friends] who are LGBT [lesbian, gay, bisexual, or transgendered]. I saw that in 2012. I am sorry for causing that pain.

By Wednesday, OkCupid had removed its message to Firefox users, but the next day, Eich resigned.

Hampton Catlin, a developer who couldn’t marry or start a business with his partner until the Supreme Court ruled last year that backers of Proposition 8 lacked standing, had blogged that he and his husband Michael would be pulling their product from the Mozilla Marketplace. After Eich’s resignation, Hampton Catlin wrote:

I met with Brendan and asked him to just apologize for the discrimination under the law that we faced. He can still keep his personal beliefs, but I wanted him to recognize that we faced real issues with immigration and say that he never intended to cause people problems.

It’s heartbreaking to us that he was unwilling to say even that.

We absolutely don’t believe that everyone who voted yes on Prop 8 is evil. In fact, we’re sure that most of them just didn’t understand the impact the law would have. That’s why so many people have changed their mind in 4 short years – because they saw the impact and pain that the law caused to friends and family members.

People think we were upset about his past vote. Instead we were more upset with his current and continued unwillingness to discuss the issue with empathy. Seriously, we assumed that he would reconsider his thoughts on the impact of the law (not his personal beliefs), issue an apology, and then he’d go on to be a great CEO.

The fact it ever went this far is really disturbing to us.

Friday, the National Organization for Marriage called for “Americans to remove the web browser Mozilla Firefox from their personal computers to protest the company forcing out its CEO over his support of Proposition 8.” NOM President Brian Brown said, “This is a McCarthyesque witch hunt that makes the term ‘thought police’ seem modest. We urge all consumers to remove Mozilla’s Firefox web browser from their computers as a sign of protest.”

For more context:
*Brendan Eich Steps Down As Mozilla CEO [The Mozilla Blog]
*OkCupid’s Firefox protest refreshingly innovative [The Boston Globe]
*Gay marriage, Mozilla’s Brendan Eich, and the role of a CEO [The Los Angeles Times]
*The Hounding of a Heretic [Andrew Sullivan, The Dish]
*Dear Andrew Sullivan, ‘Left-Liberal Intolerance’ Did Not Bring Down Mozilla’s CEO [Michelangelo Signorile, HuffPost Gay Voices]
*The New Gay Orthodoxy [Frank Bruni, The New York Times]
*Quinn: Brendan Eich, Mozilla’s former chief executive, needed to tell us more [San Jose Mercury News]

—————

In case you missed it, here are some of the OTHER biggest news pertaining to LGBTQ issues to come out of the last week:

Judge struck down part of Ohio gay marriage law
A federal judge said Friday that he will order Ohio to recognize out-of-state gay marriages. Judge Timothy Black made the announcement in federal court in Cincinnati following final arguments in a lawsuit that challenged the constitutionality of the marriage ban. He said he will issue the ruling on April 14. This would only pertain to marriages performed out-of-state, and would not force Ohio to perform same-sex marriages.

—————

Mississippi Religious Freedom Restoration Act
Mississippi governor Phil Bryant signed the Mississippi Religious Freedom Restoration Act, which supporters said would protect religious freedoms but opponents thought could open the doors to discrimination against gays and lesbians. The bill has been compared to similar legislation that was passed in Arizona earlier this year before ultimately being vetoed by Governor Jan Brewer.

For more context:
*Melissa Harris-Perry’s letter to Phil Bryant about putting rights in God’s hands [MSNBC]

—————

Alabama representatives vote for US constitutional ban on gay marriage
The Alabama House of Representatives Wednesday approved a resolution calling for a convention to put a same-sex marriage ban in the US Constitution. Representative Patricia Todd, Alabama’s first openly gay legislator, said on the House floor, “I respect your opinion about the way I live my life and who I love, as I respect yours. I am appalled that this chamber would have resorted to something like this to make a point.”

The concept of an amendment to the US constitution to ban same-sex marriage is not new. Two days after the US Supreme Court issued its rulings on the Defense of Marriage Act and Proposition 8 in June 2013, Representative Tim Huelskamp of Kansas, along with 28 other Republican members of the House of Representatives, proposed the Marriage Protection Amendment, which would amend the US constitution to define marriage as between a man and woman only. In February 2004, President George W. Bush announced support for a constitutional amendment banning gay marriage.

—————

Five years of gay marriage in Iowa
Thursday was the fifth anniversary of the day that Iowa’s Supreme Court legalized gay marriage in a unanimous decision that made Iowa the third state — and the first in the Midwest — to allow same-sex couples to wed.

For more context:
*2009 Iowa ruling seen as gay-marriage harbinger [USA Today, The Des Moines Register]
*Iowa gay marriage ruling a turning point for justices [USA Today, The Des Moines Register]
*Same-Sex Marriage in Iowa at Five Years: Is The Trend Towards Acceptance? [KCRG]

—————

Gay Boy Scout leader removed from troop
The Boy Scouts of America removed an openly gay troop leader in Seattle, saying he made an issue out of his sexual orientation. The organization told Geoff McGrath in a letter Monday it “has no choice” but to revoke his registration after he said he was gay while being profiled by NBC News. The BSA has allowed gay scouts to participate in the organization since Jan. 1 of this year.

For more context:
*‘Extremely Disappointing’: Scouts Boot Openly Gay Troop Leader [NBC News]

This week in LGBTQ news, March 24-30

In case you missed it, here are some of the biggest news pertaining to LGBTQ issues to come out of the last week:

New Mozilla’s Proposition 8 donation leads to calls for his resignation
Mozilla’s newly appointed CEO, Javascript creator Brendan Eich, is coming under fire for his 2008 donation in support of Proposition 8. Two developers who are married and launched a tech startup together have called for a boycott until Eich is removed as CEO. By the end of last week, some Mozilla employees asked that he step down.

For more context:
*Three Mozilla Board Members Resign over Choice of New CEO [Wall Street Journal]
*Should it matter that Mozilla’s new boss donated to California’s anti-gay marriage proposition? [BizJournals.com]
*Owen Thomas’ open letter to Brendan Eich [ReadWrite.com]
*Brendan Eich’s post about Inclusiveness as Mozilla [BrendanEich.com]
*On Mozilla’s Support for Marriage Equality [Mitchell Baker’s blog]

—————

World Vision announces it will allow same-sex marriage for employees, then reverses stance
On Monday, World Vision President Richard Stearns announced that the Christian relief charity’s code of conduct would now allow employees of its American branch to enter into same-sex marriage marriages. The company lost more than 3,000 donors, and by Wednesday, reversed the decision.

For more context:
*Analysis: World Vision’s gay marriage flip-flop reflects evangelical angst as culture shifts [Salt Lake Tribune]
*World Vision’s reversal on marriage policy for gay workers is start of a conversation [Seattle Times]

—————

Stay on same-sex marriages in Michigan extended, but those marriages will be recognized
Michigan Governor Rick Snyder said the state won’t recognize more than 300 same-sex marriages performed before a court halted a decision that opened the door to gay nuptials. The announcement came a day after an appeals court indefinitely stopped any additional same-sex marriages. By the end of the week, US Attorney General Eric Holder extended federal recognition to the marriages of about 300 same-sex couples that took place in Michigan.

For more context:
*Bill Schuette: Defending traditional marriage is defending the state constitution [Detroit Free Press]
*Nancy Kaffer: Gov. Snyder needs to take a stand on issues like gay marriage [Detroit Free Press]
*The history of same-sex marriage in the US, 1970 to now [The Boston Globe]

—————

US police to get training on how to respond to transgender crime victims
The Justice Department launched a program Thursday to train local police departments to better respond to transgender individuals, help police identify hate crimes and build trust with a community that law enforcement officials say is too often reluctant to report crimes.

For more context:
*Lesbian, Gay, Bisexual, Transgender, Queer and HIV-Affected Hate Violence in 2012 [The Anti-Violence Project]

—————

Gay marriage begins in England, Wales
As of Saturday, same-sex couples in England and Wales are now legally able to get married. The law was passed by Parliament in July, and Prime Minister David Cameron has been a vocal supporter.

For more context:
*UK’s first same-sex marriages go ahead as PM speaks of ‘powerful message’ [The Guardian]
*Cameron toasts Britain’s first gay marriages [Reuters]
*David Cameron: I never expected gay marriage to cause such an uproar [The Daily Mail]

How it appeared in the newspaper vs. online: Movie psychopaths

In today’s Ideas section of The Sunday Globe, Boston Globe Graphics Editor (and my boss) Chiqui Esteban put together a graphic examining psychopaths from the movies. The graphic accompanies a Q&A with psychiatry professor Samuel Leistedt, who watched 400 movies, identified 126 psychopathic characters, sorted them into four broad clinical categories, and released his findings last month.
Click the image below to see a larger version.

As people would walk by our desks and comment on how cool the graphic was shaping up to be, we would tell them, “Just wait till you see how this plays online.

The print graphic was able to include images of just some of the characters, but for the BostonGlobe.com version, we had images for each of the 126 characters in Leistedt’s report. Online, Chiqui created a sortable datable where users could sort between type, gender and primary/secondary. Additionally, he added a slider, allowing users to isolate the time frames.


Additionally, I added a link to a PDF of today’s Ideas page so that users how the piece ran in print. In my gay marriage project for BostonGlobe.com, I’ve been including PDFs of Boston Globe front pages as a way of playing up BostonGlobe.com’s archiving potential. When possible, I’ve tried to include links to past projects, whether those links are to other web projects or PDFs of newspaper pages.

This web version of the psychopaths graphic benefitted from Chiqui’s knowledge from past projects. He has done lots of good web graphics making use of sortable databases that show or hide an array of variables:

As you can see, the web version has a different feel to it from the print version. But that’s OK. That’s going to be true for most graphics that have both print and web components, because of a few variables:

  • The print versions are constrained by whether the page is color or not. The web version, of course, can appear in a golconda of colors. In this case, the use of colors allowed us to color-code the four types of psychopaths that Leistedt included in his survey. In a quick glance, you can see the variety.
  • The total print version can be seen at once. But on the web, the interactive can’t be seen all at once, as the user will scroll and/or click to see more.
  • Whether you’re reading the newspaper in downtown Boston or Newton or all the way out in Maine, you’ll see the graphic at the same size on a page that has the same dimensions. The web version, of course, varies based on the size of your screen.
  • The print reader can’t sort, click, show or hide any of the information presented to him/her. But the user of the interactive graphic can have all of those options.
  • Because you can see photos with all 126 characters, the user can get a more complex view of the variety of psychopathy in the movies.
  • The option to not sort is just as important as the option to sort. This list includes quite a disparate list, ranging from Don Corleone to Chucky to Patrick Bateman to Thelma and Louise to Bonnie and Clyde. That covers a lot of ground, and I think we’re doing a service to the readers by giving them the options to see it all at once while also giving them the options to only see the subcategories. In print, we’d have to make that decision for them. But if they’re on a desktop or a mobile device, they can decide for themselves with their mouse or their finger.

This ran in The Sunday Globe Ideas section, which reports on ideas, people, books, and trends that would be of interest to intellectuals. It covers lots of ground, and has allowed us to do lots of great graphics. One of my favorite graphics for Ideas was a chart I did showing how Harry Potter and other fantasy characters used Joseph Campbell’s hero myth archetypes.

Go check out Chiqui’s graphic here. Check out Chiqui’s portfolio here.

Does an infographic need to be “memorable” to be good? That might depend on how you define “infographic”

After reading coverage recent study about what makes charts memorable, I was convinced that there is a fundamental divide not only on what constitutes an information graphic, but also on what graphics are meant to do.

I have spent almost 10 years of my life making information graphics. I have moved to another state to take an infographics job not once, but three times. I do not consider maps, charts or diagrams to be a passing fad. Thus, I have a vested interest in how information graphics are received and perceived. I’ll see links on news sites for and “INFOGRAPHIC,” only to find that what I’ve actually clicked on is an image of icons, big numbers, some photos and flashy colors. Friends who have worked for great news agencies have shared recent freelance stories of clients choosing big numbers of multiple colors over data, charts and diagrams. Rather, in my estimation, they are rejecting actual infographics for something else, and they’re calling that “something else” an infographic.

Thus, it was with this sense of frustration that I read a bout a recent study in which people were shown multiple visualizations of data and asked which ones were most memorable. Examples with photos, logos, icons and colors were more memorable than basic charts or pie graphs. Does this serve as validation for the dressed-up web images we see billed as “infographics” on Tumblr, Pinterest and elsewhere these days?

Fortunately, no. Doctoral student Michelle Borkin of Harvard’s School of Engineering and Applied Sciences, who helped conduct the study, said “Icons, images, and human-recognizable objects will instantly make [a visualization] more memorable… But there’s this very careful caveat — and this is me speaking as a viz design person: make sure they’re helping your reader understand the main point of your data.”

I’m glad Borkin made that last point. If you remember a graphic’s presentation but you don’t remember the graphic’s content, is that really a success? I’ve seen pie charts made with actual pies, showing data from Thanksgiving studies. Or so I think. I remember the chart, but I have no memory of what it was trying to tell me.

When discussing this with colleagues at work, I said that while I do not remember all the specific articles I read on Sept. 12, 2001, I do remember the information in those articles. And I think the information and story itself is much more important than the vessel that brought you that information and story, whether the vessel was an article or an information graphic. When you’re showing a declining crime rate, what do you want the reader to ultimately remember: the trend in crime, or that you used a 75% Periwinkle 2-point stroke on the fever chart over two columns? As long as they remember that they saw the chart, and the information within, then I’m happy.

Sometimes, a graphic will require more images and colors than a simple stock chart. But I’d reiterate that decisions made in making infographics should be made because the chart requires it and it helps communicate your ultimate point. If we are adding elements just to “dress it up” or to “make it pretty,” we’re losing focus of the goal of an information graphic. Like a good news article, a good information graphic should convey information clearly in a way that does not confuse the reader. If we end up making decisions about infographics not based on the content, the graphic suffers.

There is a tendency for photos and graphics to be referred to as the page’s “art.” If the lead art falls through, the other photos and graphics on the page sometimes have to change to make up for it. On the idea of information graphics as art, Charles Blow of The New York Times once famously said: “I would like to make a distinction between information graphics and art in terms of their missions. Art need serve no purpose but to express the vision of the artist. On the other hand, the highest purpose of an information graphic is to clearly express the relationships among data. That said, if someone should call a chart art because of its beauty or message, that person would get no argument from me.”

If the live “Sound of Music” was recast with famous quarterbacks

The live version of “The Sound of Music” got a lot of press, tweets and Facebooks. I didn’t watch the broadcast, but I couldn’t help inferring that musical theatre fans thought of this event the way football fans view a BCS bowl game. Thus, I decided to parse the reviews, tweets and posts about this Carrie Underwood version of “The Sound of Music” and match the actors with well-known quarterbacks.

Carrie Underwood was apparently Tim Tebow, plucky and earnest but not universally accepted as “ready for the big time.” If you dislike Tebow, use Blaine Gabbert in this comparison instead. Like Carrie Underwood, Tebow and Gabbert are talented but not showing the desired results because they’re not in roles suitable for their abilities and background. Of course, both Gabbert and Tebow — like Underwood — have naysayers that pan them as just no good.


Stephen Moyer in “True Blood” is Johnny Manziel’s 2012 A&M season: amazing, beloved, worthy of accolades. Stephen Moyer in “The Sound of Music” is Manziel’s 2013 A&M season: not as strong, and certainly not better than his predecessors, but not horrible. He’s in spots, and not commanding or confident, but certainly not abysmal, either.

Tony winners Audra McDonald as the Mother Abbess and Laura Benanti as the Baroness would be Joe Montana and/or Tom Brady: established heavyweights whose awards and years of experience as winners have shown they have the chops. Brady might be hated, but remember, those nuns and the Baroness were kind of bitchy.

The rest of the cast of the live broadcast of “The Sound of Music” was less discussed, partially because so much attention was spent talking about Underwood’s perceived weaknesses or the impressive performances by Benanti and McDonald. With that perspective in mind, the collective cast could be seen as middle-of-the-pack South Carolina quarterback Connor Shaw: decent, but not so bad or so good that he merits a lengthy discussion.

But given the circumstances, all of these players, both on the field and on the stage, are doing the best they can do. And way better than I could do as a singer. Or as a quarterback. Or as a singing quarterback.